Covid and other respiratory viruses in the US and Canada

The3Amigos

Senior Member
Joined
Dec 3, 2023
Messages
7,604
Likes
866
Country flag
While it is true WHO has ended the state of emergency for covid, the virus persists in the community and, along with other respiratory viruses, pose a challenge to the healthcare system, especially to children, the elderly, the immunocompromised. So this thread will track the prevalence and spread of covid and its many variants and subvariants. The US and Canada numbers can also serve as a good estimate for covid numbers around the world.
 
Last edited:

The3Amigos

Senior Member
Joined
Dec 3, 2023
Messages
7,604
Likes
866
Country flag

As COVID surge wanes, California faces backlash over ‘outrageous’ new rules
By Aidin VaziriJan 26, 2024


The winter wave of respiratory viruses in California is steadily receding, with hospital admissions for COVID-19 and flu falling back to levels seen before Christmas.

Stephen Lam/The Chronicle 2023

The expected winter wave of respiratory viruses in California is steadily receding, with hospital admissions for COVID-19 and influenza falling back to levels seen before Christmas, according to figures reported by the state Friday. Health facilities and the public have fared much better this winter compared with the previous three seasons of the pandemic.
Yet amid the substantial decline in serious illnesses and deaths, critics are concerned that a new state policy easing isolation recommendations for people exposed to or infected with the coronavirus could potentially reverse the progress.
There have indeed been significant improvements in several key metrics, including a 53% reduction since the start of the year in weekly emergency department visits nationwide attributed to the “tripledemic” of COVID-19, influenza, and respiratory syncytial virus.

In California, COVID-19 hospital admissions have fallen to an average of 419 per day, down 27% from their peak on Jan. 3, according to the latest health department data.
Over the past week, an average of 2,332 people have been in the hospital each day with COVID-19 in the state, down from nearly 2,800 at the start of the year. California’s test positivity rate has fallen to 10.6% from a recent peak of 12.3% just after Jan. 1.
Though more than 1,700 Americans are still dying each week from the virus, that figure is much lower than it was during the first winter wave in 2021, before vaccines were widely available, when approximately 26,000 people died in the third week of January. Last year, weekly deaths peaked at just over 3,600 during the same period.
Wastewater samples from around the Bay Area also signal reduced coronavirus levels in local sewage, aside from a couple of hot spots in San Francisco and Napa.
Set against this backdrop of encouraging trends, the state’s new COVID-19 guidelines are meant to reflect diminished risk to the public. Rolled out this month, the revised policy from the California Department of Public Health significantly reduces the recommended isolation period for infected individuals.

Californians with mild and improving symptoms can return to work or school after being fever-free for just 24 hours, although they’re advised to continue masking and to maintain distance from individuals at high risk for severe illness for 10 days. Individuals with no evident symptoms are no longer required to undergo isolation.
The state’s move has sparked substantial concerns and discussions among experts and the public, with some worried it could lead to an increase in infections.

Guidance faces backlash: ‘It is outrageous’
California is the first state to diverge from guidelines established by the U.S. Centers for Disease Control and Prevention, which still advocate for a minimum of five days of isolation after initially testing positive for the coronavirus or experiencing symptoms.
The California Department of Public Health justifies the change, stating that the state is now at “a different point in time with reduced impacts from COVID-19” due to broad immunity from vaccination and natural infection, along with readily available treatments for infected individuals.

“Previous isolation recommendations were implemented to reduce the spread of a virus to which the population had little immunity and had led to large numbers of hospitalizations and deaths that overwhelmed our health care systems during the pandemic.”
The agency declined to elaborate on the science behind its decision, which has drawn condemnation from some infectious diseases specialists.
Dr. Michael Mina, an epidemiologist and former assistant professor of epidemiology at Harvard T. H. Chan School of Public Health, is among those expressing strong criticism, stating that the guidance “essentially encourages” infectious people to return to work and school, potentially spreading the virus to others.
“It is outrageous,” he said in a social media post.
Mina emphasized the importance of rapid tests over relying solely on fever as an indicator of infectiousness. He also underscored the need to balance societal limitations with mitigating the spread of the disease, endorsing the CDC’s five-day rule.

“We no longer live in a world where we have to guess on this issue,” Mina wrote. “We have very simple and increasingly affordable diagnostics that can provide people (including school nurses and the like) to see what used to be invisible and thus not put others at risk.”
The concerns raised extend beyond immediate infection risks. Experts such as Dr. Steven Deeks, a professor of medicine at UCSF, highlighted the lingering threat of long COVID.
“Long COVID is real and although all the signs suggest it is less common now than it was back in the beginning, it has not gone away,” Deeks said. “This needs to be part of the discussion as to when and how to relax guidance around masking and returning to work or school.”
Dr. Peter Chin-Hong, also of UCSF, said the updated recommendations were reasonable, given the high level of COVID-19 immunity now present in the community. But he cautioned that the effectiveness of the new rules also depends on individual behavior. Few people, especially children, are up to date on their vaccinations or willing to wear a mask for 10 days after testing positive for the coronavirus.
As of Jan. 13, only 21.5% of adults and 11% of children in the U.S. had received the latest updated COVID-19 vaccine, per CDC data.

New dominant variant no more severe, CDC finds
On a more positive note, early data from the CDC has found that the most prevalent variant of the coronavirus currently in circulation in the U.S. is likely no more virulent than its predecessors. The JN.1 variant is now estimated to be responsible for about 86% of COVID cases nationwide. But the CDC said this past week that there’s no evidence it causes more severe illness.
During a webinar with lab officials, the CDC’s medical epidemiologist, Dr. Eduardo Azziz-Baumgartner, highlighted that the data so far indicates JN.1 — an offshoot of the BA.2.86 omicron strain — could even be less severe than previous variants. But he warned that it could still be deadly for some individuals.
“It’s important to remember that how a virus affects an individual is unique,” he said. “It could be very severe. People could die from a virus that, to the general population, may be milder.”
The CDC seeks to gather more data on this variant over the next few weeks to provide a more comprehensive risk assessment.
 
Last edited:

The3Amigos

Senior Member
Joined
Dec 3, 2023
Messages
7,604
Likes
866
Country flag
California health officials shorten COVID isolation period to 1 day


The3Amigos

Senior Member
Joined
Dec 3, 2023
Messages
7,604
Likes
866
Country flag

Ottawa
High COVID levels persist as other illnesses dip
Emergency room visits in Ottawa drop for 3rd straight week

Andrew Foote · CBC News · Posted: Jan 25, 2024 10:26 AM EST | Last Updated: January 25
People walk along a train platform.

Commuters walk along the platform at Ottawa's Rideau station in January 2023. (Matthew Kupfer/CBC)
Social Sharing
  • Facebook
  • X
  • Email
  • Reddit
  • LinkedIn
Recent developments:
  • Ottawa's COVID-19 numbers are generally high and stable.
  • Flu signals, while still high, are dropping again.
  • RSV trends drop to more moderate levels.
  • Nineteen more COVID deaths have been reported locally.
The latest
Flu numbers dropped again over the last week, according to the latest data from Ottawa Public Health (OPH), and RSV trends did the same. Flu levels remain high and RSV's are more moderate.
The COVID-19 picture remains generally high and stable.
Meanwhile, both the number of respiratory-related and overall emergency room visits in the city have dropped for three straight weeks.
Experts recommend people cover coughs, wear masks, keep hands and often-touched surfaces clean; stay home when sick and keep up with COVID and flu vaccines to help protect themselves and other vulnerable people.
OPH says the city's health-care institutions remain at high risk from respiratory illnesses, as they have been since the end of August. This is expected to be the case until at least March.
In Ottawa
Spread

There was a major adjustment to Ottawa's recent coronavirus wastewater average in the past week.
The capital hit its highest average of 2023 on New Year's Eve, then seemed to drop significantly based on last week's snapshot.
That data now suggests Ottawa hit its second-highest average and highest daily reading on record on Jan. 12.
As of Jan. 22, it had fallen slightly from that peak. It's been generally rising for more than six months.
A chart of the level of coronavirus in Ottawa's wastewater since January 2023.

Researchers have measured and shared the amount of novel coronavirus in Ottawa's wastewater since June 2020. This is the data for 2023 and 2024 up to Monday. (613covid.ca)
OPH says the wastewater signal is very high.
The weekly average test positivity rate in the city is a stable 15 per cent, which OPH still sees as high.
Hospitalizations, outbreaks and deaths
In the past week, the average number of Ottawa residents in local hospitals for COVID-19 is a stable 49.
A separate, wider count — which includes patients who tested positive for COVID after being admitted for other reasons, were admitted for lingering COVID complications or were transferred from other health units — has fallen to its lowest level since October.
A chart showing the number of people in Ottawa hospitals with COVID.

Ottawa Public Health has a COVID-19 hospital count that shows all hospital patients who tested positive for COVID, including those admitted for other reasons and who live in other areas. (Ottawa Public Health)
OPH considers the number of new COVID-related hospitalizations in the city — 43 — as high.
The active COVID outbreak count is stable at 25, mostly in long-term care or retirement homes. There is a high number of new outbreaks.
The health unit reported 264 more COVID cases and five more COVID deaths in the last week. All victims were people age 80 or above.
OPH's next vaccination update is expected Monday.
After nearly four years, OPH said it is also ending its COVID-specific dashboard next month. Its respiratory updates will continue.
Across the region
The Kingston area's health unit says it's also in the midst of a high-risk time for respiratory illness. Its COVID-19, flu and RSV pictures are all stable: COVID and flu are at higher levels and RSV is looking lower.
The Eastern Ontario Health Unit (EOHU)'s big-picture assessment rates the overall respiratory risk as moderate and stable.
Hastings Prince Edward (HPE) Public Health, like Ottawa, gives a weekly COVID case hospital average. That has fallen again to 18. Flu activity there is seen as low.
Western Quebec has a stable 51 hospital patients who have tested positive for COVID. The province reports one more COVID death there.
HPE reported five more COVID deaths in its weekly update. The EOHU and Kingston area each reported three more and Leeds, Grenville and Lanark (LGL) counties reported two more.
LGL data goes up to Jan. 14, when its trends were generally high and dropping. Renfrew County's next update is expected later Thursday.
CBC's Journalistic Standards and Practices|About CBC News
Corrections and clarifications|Submit a news tip|Report error

RELATED STORIES
 

The3Amigos

Senior Member
Joined
Dec 3, 2023
Messages
7,604
Likes
866
Country flag

New Brunswick's COVID-19 pandemic death toll reaches at least 1,000
COVID and flu killed 5 people Jan. 7-13, six children under four among 67 people hospitalized


Bobbi-Jean MacKinnon · CBC · Posted: Jan 23, 2024 5:00 AM EST | Last Updated: January 23
A close-up of a COVID-19 rapid test kit and device, showing a negative result.

COVID-19 has killed 64 New Brunswickers since the beginning of the respiratory season on Aug. 27, according to the Department of Health data (Alexandre Silberman/CBC News)
Social Sharing
  • Facebook
  • X
  • Email
  • Reddit
  • LinkedIn
167
comments
Two more deaths from COVID-19 have pushed New Brunswick's official pandemic death toll to 1,000, although the total is likely higher since the province has counted only people who die in hospital as COVID deaths since September.
The two people who died between Jan. 7 and Jan. 13 were both aged 65 or older, according to Tuesday's Respiratory Watch report.
Public Health has reported 1,000 COVID deaths since March 2020, said Department of Health spokesperson Sean Hatchard.
"That includes 64 deaths that have been recorded during the current respiratory illness season that began on Aug. 27, 2023. The total number of COVID deaths prior to this season was 936," he said in an emailed statement.
CBC requested an interview with Dr. Yves Léger, the province's acting chief medical officer of health.
"When there is something new or noteworthy to share with the public, or if its advice or guidance for the public were to change, Public Health ensures staff are available to provide information to the media," Hatchard replied. "That may include an interview or a statement, depending on the individual situation."
Decreases in activity
COVID-19 activity in the province remains "moderate," he said, with "most indicators" decreasing throughout the reporting period.
The report also shows less influenza activity compared to the previous few weeks, said Hatchard, citing decreases in deaths, hospitalizations and cases.
"Public Health expects the viruses to continue circulating in the province throughout the respiratory illness season, and that is why it is important that individuals continue taking precautions to reduce their risk of contracting or spreading a virus," he said.
Some of these include staying up to date on vaccinations, staying home when sick, wearing a well-fitting mask in crowded places, and ensuring "good ventilation," Hatchard said.
36 COVID hospitalizations, 6 in ICU
Thirty-six people were hospitalized for or with the virus during the reporting week, which represents a 25 per cent decrease from the 48 hospitalized in the previous report.
Among those hospitalized are three children under four, two people aged 20 to 44, nine aged 45 to 64, and 22 aged 65 or older.
Six of them required intensive care, up from five.
A graphic showing each province's COVID-19 hazard index and the national average on a scale of one to 10, all with 'severe' scores illustrated in red.

The COVID-19 hazard in all jurisdictions is considered 'severe,' but New Brunswick is third highest, with a score of 22.3. (COVID-19 Resources Canada)
Fourteen COVID outbreaks have been confirmed by labs, including eight in nursing homes and six in "other facilities." A week prior there were 13 outbreaks.
The number of new COVID cases confirmed through PCR (polymerase chain reaction) lab tests has dropped by more than a third to 89, from 142. The positivity rate is seven per cent, down from nine.
A total of 136,072 COVID XBB.1.5 vaccines have been administered since Oct. 4, according to the Department of Health.
Flu kills 3
The flu killed three people between Jan. 7 and Jan. 13, all aged 65 or older. That's down from six deaths the previous week.
Hospitalizations because of the flu dropped nearly 56 per cent to 31, from 70. Four of these people required intensive care, up from three.
Among those hospitalized were three children under age four, and one youth aged five to 19. The others included three people aged 20 to 44, seven aged 45 to 64, and 17 aged 65 or older.
There were five lab-confirmed flu outbreaks, down from nine.
Two new "influenza-like illness" outbreaks were also reported in schools. No information about the schools, the number of cases or whether it's students or staff affected has been released.
School outbreaks are based on 10 per cent absenteeism in a school because of influenza-like illness symptoms, the report says.
Lab-confirmed new cases also decreased to 158, from 316. The positivity rate is now 12 per cent, down from 21 per cent.
Of these, 156 were influenza A and two were influenza B.
The latest cases raise the total number of cases since the season began on Aug. 27 to 2,009.
As of Tuesday, 206,871 New Brunswickers have been vaccinated against the flu since Oct. 4, according to the Department of Health.
Horizon sees 233% increase in COVID-positive workers
Horizon Health Network has seen a steep rise in the number of health-care workers off sick with COVID-19 in the past week, its COVID report shows. Thirty staff have tested positive with a rapid test or PCR test, as of Saturday, up from nine.
Horizon struggled with emergency department wait times and overcrowding over the holidays, due in part to staff shortages created by illness and vacancies, and a "major surge" of "very ill" patients, interim president and CEO Margaret Melanson has said.
Horizon's COVID-19 hospitalizations also increased week-over-week. It has 46 active COVID patients, up from 39, while the number of patients admitted to intensive care remains unchanged at four.
A number of Horizon hospital units have COVID outbreaks, as of Tuesday. They include:
  • Moncton Hospital — cardiac step down, orthopedics, family practice/palliative care.
  • Saint John Regional Hospital — family medicine.
Vitalité Health Network updates its COVID report only monthly, on the last Tuesday of every month.
It has not updated its COVID outbreaks page since Jan. 16, when it reported no outbreaks.
About 1 in 11 infected, says researcher
About one in 11 New Brunswickers are infected with COVID-19, according to an infectious diseases researcher and co-founder of COVID-19 Resources Canada.
Infections are roughly 31 times higher now than compared to the lowest point of the pandemic in Canada, based on wastewater data, Tara Moriarty posted on social media Sunday.
Hospitalizations are nearly 15 times higher, deaths almost 17 times higher, and long COVID cases more than 33 times higher, according to Moriarty, an associate professor at the University of Toronto.
Dr. Maria Van Kerkhove, Technical Lead of the World Health Organization for COVID-19.

Maria Van Kerkhove, WHO's director of epidemic and pandemic preparedness and prevention, said COVID-19 is 'causing far too much burden when we can prevent it.' (Reuters)
New Brunswick's COVID-19 hazard index for Jan. 20 through Feb. 2 is "severe" and third highest in the country at 22.3, she said. Only Quebec and Newfoundland are higher at 24.9 and 24, respectively.
The national average is 21.2.
The six-level hazard index is calculated based on several variables, such as COVID-19 wastewater data, test positivity rates, hospitalizations, intensive care unit admissions and deaths.
'Still a global health threat'
COVID-19 is "still a global health threat," according to the World Health Organization's director of epidemic and pandemic preparedness and prevention.
"The numbers of deaths have reduced drastically since its peak a couple of years ago, but we still have around 10,000 deaths per month," said Dr. Maria Van Kerkhove, noting that's data from only 50 countries.

"What's difficult right now is that the virus continues to evolve," she said in a recent video post on social media. "We are two years into Omicron, we have a virus that will continue to change as we let it circulate rampantly."
In addition, "we don't necessarily know how often we're getting infected," said Van Kerkhove, an infectious disease epidemiologist.
"And our concern is in five years from now, 10 years from now, 20 years from now — what are we going to see in terms of cardiac impairment, of pulmonary impairment, of neurologic impairment? We don't know.
"We don't know everything about this virus. It's year five of the pandemic. And I know it feels a lot longer, but there's still a lot that we don't know about it."
 

The3Amigos

Senior Member
Joined
Dec 3, 2023
Messages
7,604
Likes
866
Country flag

B.C. reports another influenza-related child death, bringing total to 4 this respiratory season

4th flu-related child death reported in B.C.


Ian Holliday
CTVNewsVancouver.ca Reporter
Contact
Updated Jan. 25, 2024 8:39 p.m. EST
Published Jan. 25, 2024 7:25 p.m. EST
Share
  • Link
  • X
  • Reddit
  • LinkedIn
  • Email
Another child under the age of 10 has died while suffering from influenza, the B.C. Centre for Disease Control confirmed in its weekly update on respiratory illness Thursday.
The latest death was reported during the week of Jan. 14 to 20, according to the centre, which provided no additional information about the deceased.

The BCCDC says there have now been four influenza-related pediatric deaths during the 2023-24 respiratory illness season.
An "influenza-related death" is one "where influenza was a contributing factor but not necessarily the primary cause of death," the BCCDC says on its website.
RELATED STORIES
In a statement to CTV News, the BCCDC confirmed that the latest death was "newly reported."
"In all cases, the children have been under the age of 10, and due to the small numbers, we are not confirming the health authority at this time," the agency said in a statement.
"However, we can share that the reports came from different parts of the province. We send our condolences to the families and communities affected by the loss of their loved ones."
Often, children who die while battling viral respiratory illnesses do so because of separate bacterial infections that prey on their weakened immune systems.
The BCCDC warned in its statement that secondary bacterial infections "can cause a child to get very sick very quickly."
Rapid worsening of symptoms, prolonged fever and difficulty breathing are among the signs that a child needs immediate medical attention, the agency said.
The four flu-related deaths announced this season include two of the four children who have died from invasive group A streptococcal bacteria infections in recent months, meaning at least six children under 10 have now died from either the flu, strep, or both.
The BCCDC warned last week that the province "continues to experience higher levels" of group A strep infections than normal.
Respiratory illness data
The latest child death comes as influenza and RSV infections continue to decline in the province, overall.
Since peaking at 19.1 per cent in the last week of December, the test positivity rate for influenza in B.C. has declined to 10.1 per cent as of the most recent epidemiological week, which ended Jan. 20.
RSV positivity has also declined, falling to 6.7 per cent in the most recent update, down from a peak of 9.9 per cent in the first week of the year.

COVID-19 cases and test positivity also declined in the latest update from the BCCDC.
There were 413 new lab-confirmed COVID infections in B.C. during the week of Jan. 14 to 20, down from 548 the week before.
Test positivity dropped from 12.2 per cent to 10.8 per cent.
The number of patients currently in hospital with COVID-19 is essentially unchanged in the latest update. The BCCDC reported 168 such patients on Thursday, while there were 172 at this time last week.
The number of people in B.C. hospitals with COVID-19, as reported by the BCCDC since January 2023, is shown. (CTV)
 

The3Amigos

Senior Member
Joined
Dec 3, 2023
Messages
7,604
Likes
866
Country flag

COVID Map Shows States With Higher Case Rates
Jan 29, 2024 at 5:25 AM EST

COVID Map Shows States With Higher Case Rates

By Aleks Phillips
U.S. News Reporter

States across eastern and central America, as well as the northwest, are among those that have a higher prevalence of COVID-19 infections in the most-recent recorded week, maps produced by the Centers for Disease Control and Prevention (CDC) show.
Only two of the federal agency's administrative regions—covering the Plains and the southwest, as well as Hawaii—had, on average, a prevalence of antigen tests returning positive results of less than 10 percent of those taken in the week ending January 20. However, New England saw the most-elevated proportion of positive tests, figures released on Friday show.

The recent uptick in positive cases and hospitalizations with COVID-19, which now appears to be waning, is something health officials have been expecting during the winter months. Colder weather tends to lead to an increased spread of viruses and other infections as immunity is lower.
Covid test positivity map January 20

A representation of the rates of test positivity among CDC administrative regions in the week ending January 20, 2024. Yellow denotes rates between 10 and 14.9 percent, and green rates between 5 and 9.9 percent.CDC
The CDC reported that, nationwide, the prevalence was around 10.8 percent of tests undertaken—a 1.2 percent decrease from the previous recorded week. The geographic picture of where positive cases are occurring shows test positivity dropping off for many regions following the holiday period, when travel and social mixing tends to be a factor in the spread of the virus.
Elevated infections of respiratory diseases such as COVID-19 and influenza led some hospitals in states with high population densities to bring in fresh mask mandates toward the end of 2023.

The CDC does not give test positivity percentages for individual states anymore, instead giving them as an average across its administrative regions. Region Two—which includes New York and New Jersey—had an overall prevalence of 14 percent positive tests out of 4,369 taken across the two states, down a marginal 0.9 percent on the prior week.
Region One—comprised by Connecticut, Maine, Massachusetts, New Hampshire, Rhode Island and Vermont—had a test positivity rate of 12 percent out of 5,729 taken, a decrease of 2.1 percent on the previous week.

By contrast, Region Eight—which covers Colorado, the Dakotas, Montana, Utah and Wyoming—had a rate of positive tests of 8.5 percent, down a percentage point on the prior week; and Region Nine—California, Hawaii, Nevada and New Mexico—had a rate of 7.4 percent, a drop of 5 percent.
All other administrative regions had test positivity rates above 10 percent, though not as high a proportion as Regions One and Two.
The CDC said that the data did not include tests taken at home and added that the results may be subject to change due to delays in testing centers reporting back.

"The data represent laboratory tests performed, not individual people," the CDC added, as one person may be administered multiple tests in a week. The agency said that the percentage of positive tests "is one of the metrics used to monitor COVID-19 transmission over time and by area."
Meanwhile, across the U.S., hospitalizations with COVID-19 continued a three-week decline from a seasonal peak between the weeks of December 30 and January 6. Alaska and New Mexico were the only two states to see moderate increases in hospital admissions, of more than 10 percent.
 

The3Amigos

Senior Member
Joined
Dec 3, 2023
Messages
7,604
Likes
866
Country flag

COVID Tracker | Average daily cases fall 24%; deaths down as well
January 23, 2024
Bridge Staff
Michigan Health Watch
Coronavirus Michigan
SHARE THIS:
Share this article on Twitter
Share this article on Facebook
Share this article on LinkedIn
Share this article via email
Print this article

Bridge Michigan
Michigan Health Watch
COVID Tracker | Average daily cases fall 24%; deaths down as well
SHARE THIS:
Share this article on Twitter
Share this article on Facebook
Share this article on LinkedIn
Share this article via email
Print this article
Donate

Last updated: Tuesday, Jan. 23, at 4:02 p.m. This post will be continuously updated with Michigan coronavirus locations and updated COVID-19 news.


For more interactive maps and charts, see the Michigan Coronavirus Dashboard, showing vaccine distribution information, case numbers, locations, deaths and demographics.
Confirmed COVID-19 cases dropped 24 percent to an average of 523 cases per day from 684 the week before, Michigan public health officials reported on Tuesday.
The state also reported 82 confirmed COVID-19 deaths, down nearly 50 percent from 156 reported the previous week.
Of the deaths, 51 occurred in December, bringing that month’s total to 279. There were 621 in December 2022. Another 24 of the deaths occurred this month.
The decline in cases comes as the number of confirmed COVID-19 hospital patients has fallen. The state’s 164 hospitals reported 788 confirmed COVID-19 patients on Monday, down from 999 a week earlier and 1,275 on Jan. 3, the peak of this winter’s surge. In past years, there have been as many as 5,000 COVID-19-positive hospital patients.
Experts say that state-confirmed cases are likely a vast undercount because many people either no longer test for the virus when they have symptoms or rely on home tests. Still, case counts are an indication of overall trends.— Mike Wilkinson
Tuesday, Jan. 16
Deaths increase

Michigan public health officials reported an additional 156 COVID-19 deaths on Tuesday, the most reported in a single week since November 2022.
Of those, 92 occurred in December, bringing the monthly total to 228 — the most in a month since 273 in February 2023.
Even so, the total was the lowest for the month of December since the pandemic began: There were 621 that month in 2022, compared to 3,394 in December 2021 and 3,316 in December 2020.
While more deaths could be reported in coming weeks, 2,222 COVID-19 deaths were reported in 2023, by far the lowest of the pandemic. There were 9,325 deaths in 2022, 15,004 in 2021 and 13,019 in 2020.
Related: Michigan businesses ask court to make state pay for COVID-19 losses
The increase in reported deaths followed a weeks-long increase in confirmed cases and hospitalizations that now appears to be in decline.
Confirmed cases fell 36 percent this past week to 4,785. That was the second straight week of decline. Hospitalizations, which hit 1,275 on Jan. 3, fell to 999 on Monday, the lowest since it was 962 on Dec. 20.
Of the deaths, 22 were in November and 25 in January.
Experts say that state-confirmed cases are likely a vast undercount because many people either no longer test for the virus when they have symptoms or rely on home tests. Still, case counts are an indication of overall trends.— Mike Wilkinson
 

The3Amigos

Senior Member
Joined
Dec 3, 2023
Messages
7,604
Likes
866
Country flag


HEALTHCARE
Oklahoma tops 20,000 COVID-19 deaths, 2nd highest death rate in the nation
Alexia Aston
The Oklahoman

Oklahoma has the second highest COVID-19 death rate in the nation as the state recently topped 20,000 COVID-19 deaths since 2020.
Here's what COVID-19 currently looks like in Oklahoma.
Which Oklahoma counties have the most COVID-19 deaths?
With 20,055 deaths, the rate of COVID-19 deaths per 100,000 people is 437.5 in the entire state, according to data from the Centers for Disease Control and Prevention.
Oklahoma County leads in total deaths with 2,668, followed by Tulsa County at 2,313 and Cleveland County at 777, according to data from The New York Times.
 

The3Amigos

Senior Member
Joined
Dec 3, 2023
Messages
7,604
Likes
866
Country flag

Respiratory illnesses remain 'elevated' throughout much of country: CDC
By
Brie Stimson
Published January 27, 2024 3:49PM
Health
FOX News

6782706d-
article
Getty Images
Respiratory illnesses that include a fever plus a cough or sore throat, causing people to seek medical care in the United States, have remained elevated in the last two weeks, the Centers for Disease Control (CDC) said Friday.
"This week, 22 jurisdictions experienced high or very high activity compared to 37 jurisdictions two weeks ago," the agency said in an update, noting that there had been some decreases.
https://searchthese.net/index.php
While COVID-19, RSV and flu positivity rates remained elevated nationally, COVID and RSV rates decreased compared to the previous week, and flu rates stayed about the same.
THE FLU IS SOARING IN 7 US STATES AND RISING IN OTHERS, HEALTH OFFICIALS SAY

Also, visits to the emergency room for the flu, COVID and RSV have decreased as the country returns to work after gathering with family and friends for the holidays last month, spreading viruses during the height of the flu season.
Levels of COVID-19 detected in wastewater remained elevated but went down from "very high to high" and were concentrated mostly in the South, the CDC said.
States with a "very high" level of respiratory illness include New York, Tennessee, South Carolina, and Louisiana.
 

The3Amigos

Senior Member
Joined
Dec 3, 2023
Messages
7,604
Likes
866
Country flag

America is over the Covid vaccine.

Frantic lineups for scarce doses when Covid vaccines first became available have long since given way to widespread indifference. Each new round of boosters has drawn fewer bared arms than the round before it. The Centers for Disease Control and Prevention estimates that, as of Jan. 6, a mere 21.5% of Americans aged 18 and older and 11% of children have been vaccinated with the latest Covid vaccine.


But before you write off that number as a reflection of hesitancy over vaccines overall, consider this: 46.7% of Americans aged 18 and older and 47.5% of children have been vaccinated against influenza for this cold and flu season. In older adults, who are at the greatest risk from Covid, the gap is wider still; 73% of people 65 and older have received a flu shot, but only 41% have taken the Covid booster.

Why the disparity? Americans who regularly get a flu shot are just the type of people you’d expect would routinely get vaccinated against Covid. Yet as the statistics reveal, even many of them appear to have declined the latest booster.

vaccine_rates_2
CDC
It’s not clear that a single definitive answer exists; in fact there is likely a combination of explanations, say people who study vaccine acceptance and vaccine hesitancy. They see this group as both a missed opportunity and as a cohort that could be swayed.

ADVERTISEMENT

Jason Schwartz, an associate professor of health policy at the Yale School of Public Health, called people who get vaccinated against flu “the lowest hanging fruit for increasing Covid vaccine uptake.”

“These are people who are signaling right by their very actions that they are supportive of vaccines generally and that they’re supportive of the idea of an annual vaccination effort, even [with] a vaccine that is known to be less than perfect,” said Schwartz, who specializes in vaccine policy. “And the fact that those individuals are in some sense voting with their feet by … passing on Covid is a real warning sign above and beyond all the other issues these vaccination efforts face.”

The experts with whom STAT spoke about this issue expressed little surprise at the chasm between flu vaccine and Covid vaccine acceptance rates. While there are a striking number of similarities between the two vaccines — similarities health authorities might be advised to highlight more in their promotional efforts for Covid shots, some experts say — there are also intractable differences.

“I think it’s generally true that people who get flu shots are higher seekers of health care, and maybe put a greater premium on their health than people who don’t get flu shots. But … I think that the Covid vaccine is kind of in a different category,” said Sara Gorman, executive director of Those Nerdy Girls, a collective of women scientists and clinicians that formed — initially under the banner Dear Pandemic — to answer questions and dispel misinformation about Covid-19. (The group has since broadened its focus to encompass other scientific topics as well.)

NEWSLETTERSSign up for Daily Recap
All the health and medical news you need today, in one email

Privacy Policy

For starters, there’s a veneer of politics clinging to the Covid vaccine that staid old flu vaccines do not have.

“Getting a Covid vaccine has come to symbolize identity politics in a way that no other vaccine really has,” said Gorman, who is the author of the upcoming book “The Anatomy of Deception: Conspiracy Theories, Distrust, and Public Health in America.”

“It is true that people on the left tend to get more vaccines in general. But even if you are sort of somewhere in the middle, and you still want your flu shot, but getting a Covid shot would mean associating yourself with a certain political identity that’s really not palatable to you, then you’re not going to do it,” she said.

Heidi Larson, director of the Vaccine Confidence Project, agreed, noting there is clear evidence of a political divide on Covid vaccine acceptance, with vaccination rates substantially higher among Democrats than among Republicans. Flu vaccine is simply not part of a political identity in that same way.

There is also a cloud of discomfort surrounding Covid vaccinations — questions about safety and effectiveness — that doesn’t hover over the flu vaccine, Schwartz noted.

He drew a parallel between the response to Covid vaccines and to HPV vaccines after the latter were first approved in the mid-aughts. Those vaccines prevent infection with human papillomaviruses that cause cervical, penile, and other cancers — viruses that are transmitted mainly by sex.

HPV vaccines are highly effective and work best when given before adolescents become sexually active. But vaccinating preteens and teens to protect them against a sexually transmitted infection is a bridge some parents have been reluctant to cross. Schwartz said it’s not unusual to see adolescents come in for medical appointments to get recommended vaccinations and leave having gotten a tetanus, diphtheria, and pertussis booster and a meningococcal vaccine but no HPV shot.

Related: After grilling Fauci on Covid origins, House Republicans want to consider new rules for foreign research
That kind of behavior is not uncommon when it comes to vaccines, Gorman said, with people agreeing to some but not others. “Most people are not in the camp of getting every single vaccine or not getting any vaccines,” she said.

Part of the unease with Covid vaccines relates to the unprecedented speed with which they were developed. Also at work, the experts said, are concerns about the messenger RNA platform used by the Pfizer and Moderna vaccines. These are the first approved vaccines that deploy mRNA to teach immune systems to protect against a threat. The vaccines have been given to hundreds of millions of people; there is overwhelming evidence they are effective and safe. But the mere notion of mRNA makes some people nervous.

“It’s a different technology, the mRNA technology, which people often don’t fully understand, and I think can be afraid of [it],” Gorman said.

Anti-vaccine campaigners have leaned into those fears, attempting to link Covid vaccines to a variety of serious side effects for which there is no scientific evidence. Larson pointed to the claims that erupt on social media when high-profile figures have sudden unexplained illnesses or young athletes die unexpectedly. “There have been some pretty awful social media campaigns like the whole sudden death thing. That really scares people,” said Larson, who is a professor of anthropology and risk at the London School of Hygiene and Tropical Medicine and the University of Washington at Seattle.

“Especially with Covid, that stuff really is in the air. And people do pick up on bits and pieces of it,” Gorman said.

The short-term side effects associated with the mRNA vaccines may also be contributing to reluctance. For some people, these vaccines are a breeze, but for others, a day or two of fever, aches, and chills are guaranteed to follow a booster. “We know from other vaccines that any mark in the ‘this is inconvenient for me’ column will suppress uptake,” said Malia Jones, an assistant professor of spatial dimensions of community health at the University of Wisconsin-Madison.

Legitimate scientific debate over how well boosters work and who needs additional shots at this point could also be fueling a sense of distrust among some individuals who are otherwise open to vaccination, the experts said. These debates aren’t happening about flu shots, which have been in routine use for decades. And it is clear some primary care providers are ambivalent about the need for additional Covid shots, and as a result may not be advocating strongly that their patients stay up to date. Study after study has shown that a firm recommendation from a trusted medical professional plays a huge role in persuading people to be vaccinated.

“I think in some cases, clinicians are not recommending them as strongly as they might for people who’ve already got … five, six, seven vaccines already,” said Jones, who personally knows some doctors who question whether another booster is necessary at this point.

Related: Respiratory viruses, thrown out of whack by Covid, appear to be falling back into seasonal order
These discussions, this ambivalence — they are not lost on people who are vacillating about whether to get a Covid shot, Schwartz said. “I think it can lead to both fatigue and confusion, saying, ‘Listen, even the experts can’t figure out sort of how to think about Covid vaccines. To hell with it.’”

He believes at this point the public undervalues Covid shots and underestimates the risk the illness presents.

“We continue to see studies showing the benefits of those additional doses in terms of the new responses and in terms of outcomes. And I think, increasingly, they seem to just sort of land with a thud. I don’t see them changing the public discourse,” Schwartz said.

Larson said people aren’t wrong to conclude that the risk from Covid has eased. Covid death rates are now, thankfully, a fraction of what they were two or three years ago. She believes the massive Omicron wave that began in late 2021 changed perceptions about Covid. The new variant was so adept at transmitting that massive numbers of people who had until then avoided Covid became infected in the early months of 2022. But the new version of the virus triggered less severe illness than the Delta variant that preceded it.

“That was like a turning point where people all of a sudden were like, ‘Oh, I think we’re out of the bad bit. It’s just like the flu, or a cold,’” Larson said. But flu isn’t benign, and furthermore, Covid is still more dangerous than flu, she noted.

In the first week of January, three-and-a-quarter times more people died from a Covid infection than from flu, according to CDC data. Drawing figures like those to the public’s attention might move some people who are on the fence, she said. “It’s not going to change the extremists’ minds.”

Larson thinks health authorities should play up the similarities between flu vaccination and Covid vaccination to appeal to more people who will take the former but not the latter. Like the fact that both vaccines have to be updated regularly because the viruses evolve. Like the fact that neither vaccine offers failsafe protection against infection, but both lower the risk of serious illness and death. Like the fact that with both flu viruses and SARS-2, immunity induced by vaccination or infection wanes, and therefore revaccination is required.

People understand these things about flu vaccine. These facts are baked into their acceptance of the need for an annual flu shot. But paradoxically, with Covid, these features seem to fuel distrust of the vaccines. People who catch flu after having a flu shot surmise they would have been sicker but for the vaccine. But if people see someone they know received a Covid booster go on to get infected, they conclude the shot isn’t worthwhile, Gorman said.

Flu vaccine has a clear advantage, thanks to the fact it’s been around for eons. People don’t really have to devote too much brain time to a decision. “It’s become normalized, become a routine,” Schwartz said.

Jones believes that that’s a big part of the problem in persuading people to get vaccinated against Covid. She has talked to parents about why their kids got a flu vaccine but not a Covid shot. “It’s just still too new,” she was told. And some of the questions people quite reasonably pose — Do we need annual shots? Does everyone need an annual shot? — can’t yet be answered. That adds to the discomfort, she said.

Jones thinks there will eventually be a standing recommendation from the CDC that everyone get a Covid shot every autumn, along the lines of the recommendations for the flu vaccine. “That would help signal to some of these folks who get an annual flu vaccine that this is on a schedule. It has to be updated every so often in order to keep our immunity fresh,” Jones said.

She and others said, however, that while there are ways to make inroads with the population of people who get annual flu shots, it’s going to take time. And even then, there will be people who will not be swayed.

“I don’t think there’s any magic fix for these things. But I do think sometimes those kinds of nudges help a bit,” said Larson. “But it’s only going to be for the people that are maybe leaning to yes but are not convinced enough.”
 

The3Amigos

Senior Member
Joined
Dec 3, 2023
Messages
7,604
Likes
866
Country flag

Calgary3 children among the 10 new COVID deaths reported in Alberta since last week
Data includes known deaths up to Jan. 20 but there is a lag in reporting


Robson Fletcher · CBC News · Posted: Jan 26, 2024 12:21 PM EST | Last Updated: January 26
New COVID-19 severe outcomes in the most recent Alberta Health report vs. the report from the week before. The week of the most recent report is Jan. 14 to Jan. 20, 2024.

New COVID-19 severe outcomes in the most recent Alberta Health report vs. the report from the week before. The week of the most recent report is Jan. 14 to Jan. 20, 2024. (Data via Alberta Health, table by Robson Fletcher/CBC)
Social Sharing
  • Facebook
  • X
  • Email
  • Reddit
  • LinkedIn
507
comments
Another 10 Albertans have died from COVID, according to the latest weekly data released by the provincial government, three of whom were children.
These mark the first pediatric deaths due to COVID reported in the current respiratory virus season.
The death toll, among all ages, for the current season now stands at 430.
Two of the children who died of COVID were between the ages of one and four years old, according to a statement from Alberta Health.
The third child, who was between the ages of five and nine, died of a co-infection of COVID and influenza.
"The deaths reported are all historic deaths that would have occurred between October and December 2023," Alberta Health spokesperson Charity Wallace said in an email.
Wallace said Alberta Health would not reveal where in the province the pediatric deaths occurred, "due to privacy concerns."
The latest release also shows an additional 103 people were hospitalized for COVID, including 11 admitted to intensive care units (ICU).
In total, there have now been 3,518 hospitalizations this season, including 216 admissions to ICU.
In general, Alberta Health noted respiratory illnesses appear to be on a downward trajectory.
"Cases of influenza and RSV have been declining in the recent weeks," Wallace said in an email last week. "Although COVID-19 saw a slight increase following the holiday season, it has been steadily declining since mid-November. Hospitalizations are following a similar, delayed trajectory downward for influenza and COVID-19.
Age breakdown and data notes
Admissions do not include patients with "incidental" cases of COVID-19 admitted to hospital/ICU for other reasons.
Alberta Health says the deaths include those "resulting from a clinically compatible illness in a lab-confirmed COVID-19 case, unless there is a clear alternative cause of death identified (e.g. trauma, poisoning, drug overdose, etc.)"
These numbers represent the difference between hospitalizations and deaths in the province's most recent weekly report compared to the report from the week before, for the 2023-24 respiratory virus tracking season.
The season runs from Aug. 27, 2023, to Aug. 24, 2024.
Older people tend to be the most vulnerable to severe outcomes from COVID, but younger people can be affected, too.
The table below breaks down the total number of hospitalizations, ICU admissions and deaths in the current respiratory-virus season, by age range.
You'll also find the population-adjusted rate (per 100,000 people) for each age range.

This data all comes from the provincial government's respiratory virus dashboard, which is updated weekly.
There are often delays in reporting, however, meaning not all deaths and hospitalizations that actually happened during the latest weekly reporting period are included.
Each weekly report typically includes severe outcomes that occurred in prior weeks but were only just added to the data.
 

The3Amigos

Senior Member
Joined
Dec 3, 2023
Messages
7,604
Likes
866
Country flag

Why don't COVID tests seem to work as well as they used to?
  • By Jason Gale Bloomberg News (TNS)
  • Jan 22, 2024

LIFE-HEALTH-CORONAVIRUS-TESTS-GET


A person receives a COVID-19 test on Jan. 4, 2022, in New York City.
Angela Weiss/AFP via Getty Images/TNS


With COVID outbreaks being whipped up for a fifth year, testing has emerged as a source of frustration once again.
Whereas obtaining a test was often difficult in early 2020, now the abundance of cheaper rapid kits in grocery stores and home medicine cabinets has led to a new concern — they don’t seem to work.
“When people tell me that their rapid antigen tests never turn positive, they’re usually talking to me because they’re frustrated,” says immunologist and epidemiologist Michael Mina.

In fact, the tests work just as well as they did when they first came out. What’s changed is how our bodies are responding to the coronavirus, leading many people to test too early, says Mina, chief science officer at digital health-care company eMed LLC, which helped implement the US government’s Home Test to Treat program a year ago.
In 2020, the loss of smell and taste, fatigue, and a dry cough heralded the start of COVID-19, usually a week after the virus entered the body. “Those first symptoms came on after the virus was tearing you apart.”
Multiple vaccinations and natural infections since then have made most people “immunologically educated,” Mina says. A growing wall of immunity has enabled the body to recognize SARS-CoV-2 faster and do a better job at suppressing it, even as the virus spawned dozens of new variants.
That means nasal congestion, fever, and other early signs of viral illness can develop within a day or two of infection during a “prodromal phase” that occurs before symptoms of the disease have fully developed, according to Mina.
“That’s just our immune system saying, Hey, I’m starting to recognize something here,” he says.
The faster immune system response led some scientists to believe that the coronavirus’s incubation period has shortened over time. But the virus’s growth kinetics have changed very little since 2020, Mina says. “It still takes the same amount of time for the virus to go from, say, 10 particles to 10 million particles.”
In 2020, health authorities recommended waiting four or five days after a coronavirus exposure to get tested, reflecting when the amount of virus in the upper airway was nearing a peak and readily detectable. But the onset of prodromal symptoms and the relative ease of home testing now mean people are screening for COVID much sooner.
“A lot of people are reaching for those tests 24-to-48 hours post-exposure,” says Mina, a former assistant professor of epidemiology, immunology, and infectious diseases at Harvard’s T.H. Chan School of Public Health in Boston. “And, just like in 2020, the virus hasn’t yet grown to high levels in the nose. It really takes four, five, six days.”
Mina says “educated” immune systems are providing a kind of in-built rapid test. Instead, of indicating positivity with a new line on a test strip, the signal comes with congestion and fever.

“You might have to wait an extra day or two before you can run that confirmatory rapid antigen test after your ‘immune test’ has already started to signal that there’s something there,” he says.
Studies of transmission patterns in households early in the pandemic showed that infected people were most likely to spread the virus four to six days after exposure. The infectious window hasn’t changed significantly since then, Mina says. A person who tests negative on a rapid test two days after a coronavirus exposure remains at low risk of spreading it.
“Could you infect your spouse or somebody you’re really close with on day two? Probably,” he says. “But are you likely to be a super spreader and be negative on a test? Probably not.”
Testing positive, on the other hand, signals the presence of a lot of virus and the risk of infecting others.
Mina recommends swabbing both the throat and the mouth to improve the sensitivity of a rapid test, since virus levels across both sites can vary from person to person. Also, the coronavirus survives best at 37C (99F), making the throat a more hospitable environment than the nose.
Even when someone has mild symptoms after a coronavirus exposure and continues to return negative rapid tests over several days, it doesn’t necessarily mean they have escaped infection, or that their swabbing technique or tests are faulty, Mina says.
It could instead mean that the person’s “educated” immune system has successfully prevented the virus from reaching levels detectable on a rapid antigen test. The threshold is about 100,000 copies per milliliter — a tiny fraction of the 1 billion to 1 trillion copies per milliliter individuals can have at their infectious peak, he says.
As people’s immunity builds, more people will likely not return a positive rapid test even if they get COVID and feel unwell.
“I want every test to be falsely negative because that describes the triumph of immunity,” Mina says. “It means your immune system is doing what it should be doing.”
Still, he cautions that even when the virus is being suppressed in the respiratory tract, it could be flourishing elsewhere in the body, like the gastrointestinal tract.
“If you really think you’ve been exposed and you feel like you have GI symptoms, treatment might be right for you — it might make sense to get Paxlovid even though you don’t have a positive test,” Mina says. “The test is only as good as the sample, which is only as good as where the virus is in your body.”
 

The3Amigos

Senior Member
Joined
Dec 3, 2023
Messages
7,604
Likes
866
Country flag

Waterloo Region COVID-19 booster uptake below national average


colton-wiens-1-5530785.jpeg


Colton Wiens
CTV News Kitchener Videographer
Contact
Updated Dec. 27, 2023 7:05 p.m. EST
Published Dec. 27, 2023 5:19 p.m. EST
Share
  • Link
    0Shares
  • X
    0Shares
  • Reddit
    0Shares
  • LinkedIn
    0Shares
  • Email
    0Shares
  • 0Shares
Residents in Waterloo Region are not keeping up with the national rate for COVID-19 booster shots.
According to the Public Health Agency of Canada, as of Dec. 3, 14.6 per cent of Canadians have received the latest version of the COVID-19 booster shot, which targets the Omicron XBB.1.5 sub variant. That includes 15.1 percent of Canadians 5 years and older.

In Waterloo Region, as of Dec. 9, 10.9 percent of residents have received a COVID-19 booster dose in the last six months. Based on age range, just 0.3 percent of kids aged zero to 11 are up to date on their vaccinations, while 12.2 percent of people 12 years and older have received the latest booster.
“I wouldn’t say that it’s surprising, because in any case almost all the provinces are having a low rate of booster vaccination,” said Zahid Butt, an infectious disease epidemiologist and assistant professor at the University of Waterloo.
RELATED STORIES
According to current guidelines, Region of Waterloo Public Health recommends 71 per cent of residents should receive an additional dose.
“We need to have this annual COVID-19 shot, similar to the flu shot where it takes into account all the current variants at a particular point in time,” Butt said.
WHY IS BOOSTER UPTAKE LOW?
Butt said the slower rates could be a number of reasons.
“Pandemic fatigue, people are not really concerned about the virus now. They don’t want to take more booster shots. Another thing is, recently, thankfully, [COVID-19] hasn’t caused that much severe illness,” Butt said.
The lower vaccination numbers could also be the result of eligibility.
“It is important to be aware that many individuals may not have been eligible to receive the booster, due to a previous COVID-19 vaccination or infection within the three to six months before its release,” Region of Waterloo Public Health said.
LOCAL COVID-19 PICTURE
Deaths caused by or contributed to by COVID-19 have dropped dramatically.
Waterloo Region has reported 40 deaths related to COVID-19 in 2023, versus 190 deaths in 2022.
Currently 42 people are hospitalized in Waterloo Region with to COVID-19. At the same time last year, there were 51.
Waterloo Region is seeing three outbreaks in congregate settings and four in long-term care and retirement homes.
Butt said along with proper handwashing and staying home when you are sick, vaccinations are important to keep people healthy during respiratory illness season.

“I think you should go ahead and get those vaccines. You can get the COVID-19 and flu vaccine together. Then for people who are ages 60 and above, they should get the RSV vaccine,” Butt said.
Butt said he expects after people gather over the holidays, there will be an increase in the number of cases.
According to Region of Waterloo Public Health, the COVID-19 wastewater signal remains elevated with an expected fluctuation from week to week.
Meanwhile, Wellington Dufferin Guelph reported 41 deaths last year, down to seven this year. There is currently two COVID-19 outbreaks in long-term care and retirement homes in that health unit.
There are six reported outbreaks in Brant County. That health unit has reported 41 COVID-19 cases since December 12.
 

The3Amigos

Senior Member
Joined
Dec 3, 2023
Messages
7,604
Likes
866
Country flag

Virus Soup: Many Respiratory Viruses Peaking in Early 2024
Written by Carolyn Crist
6 min read
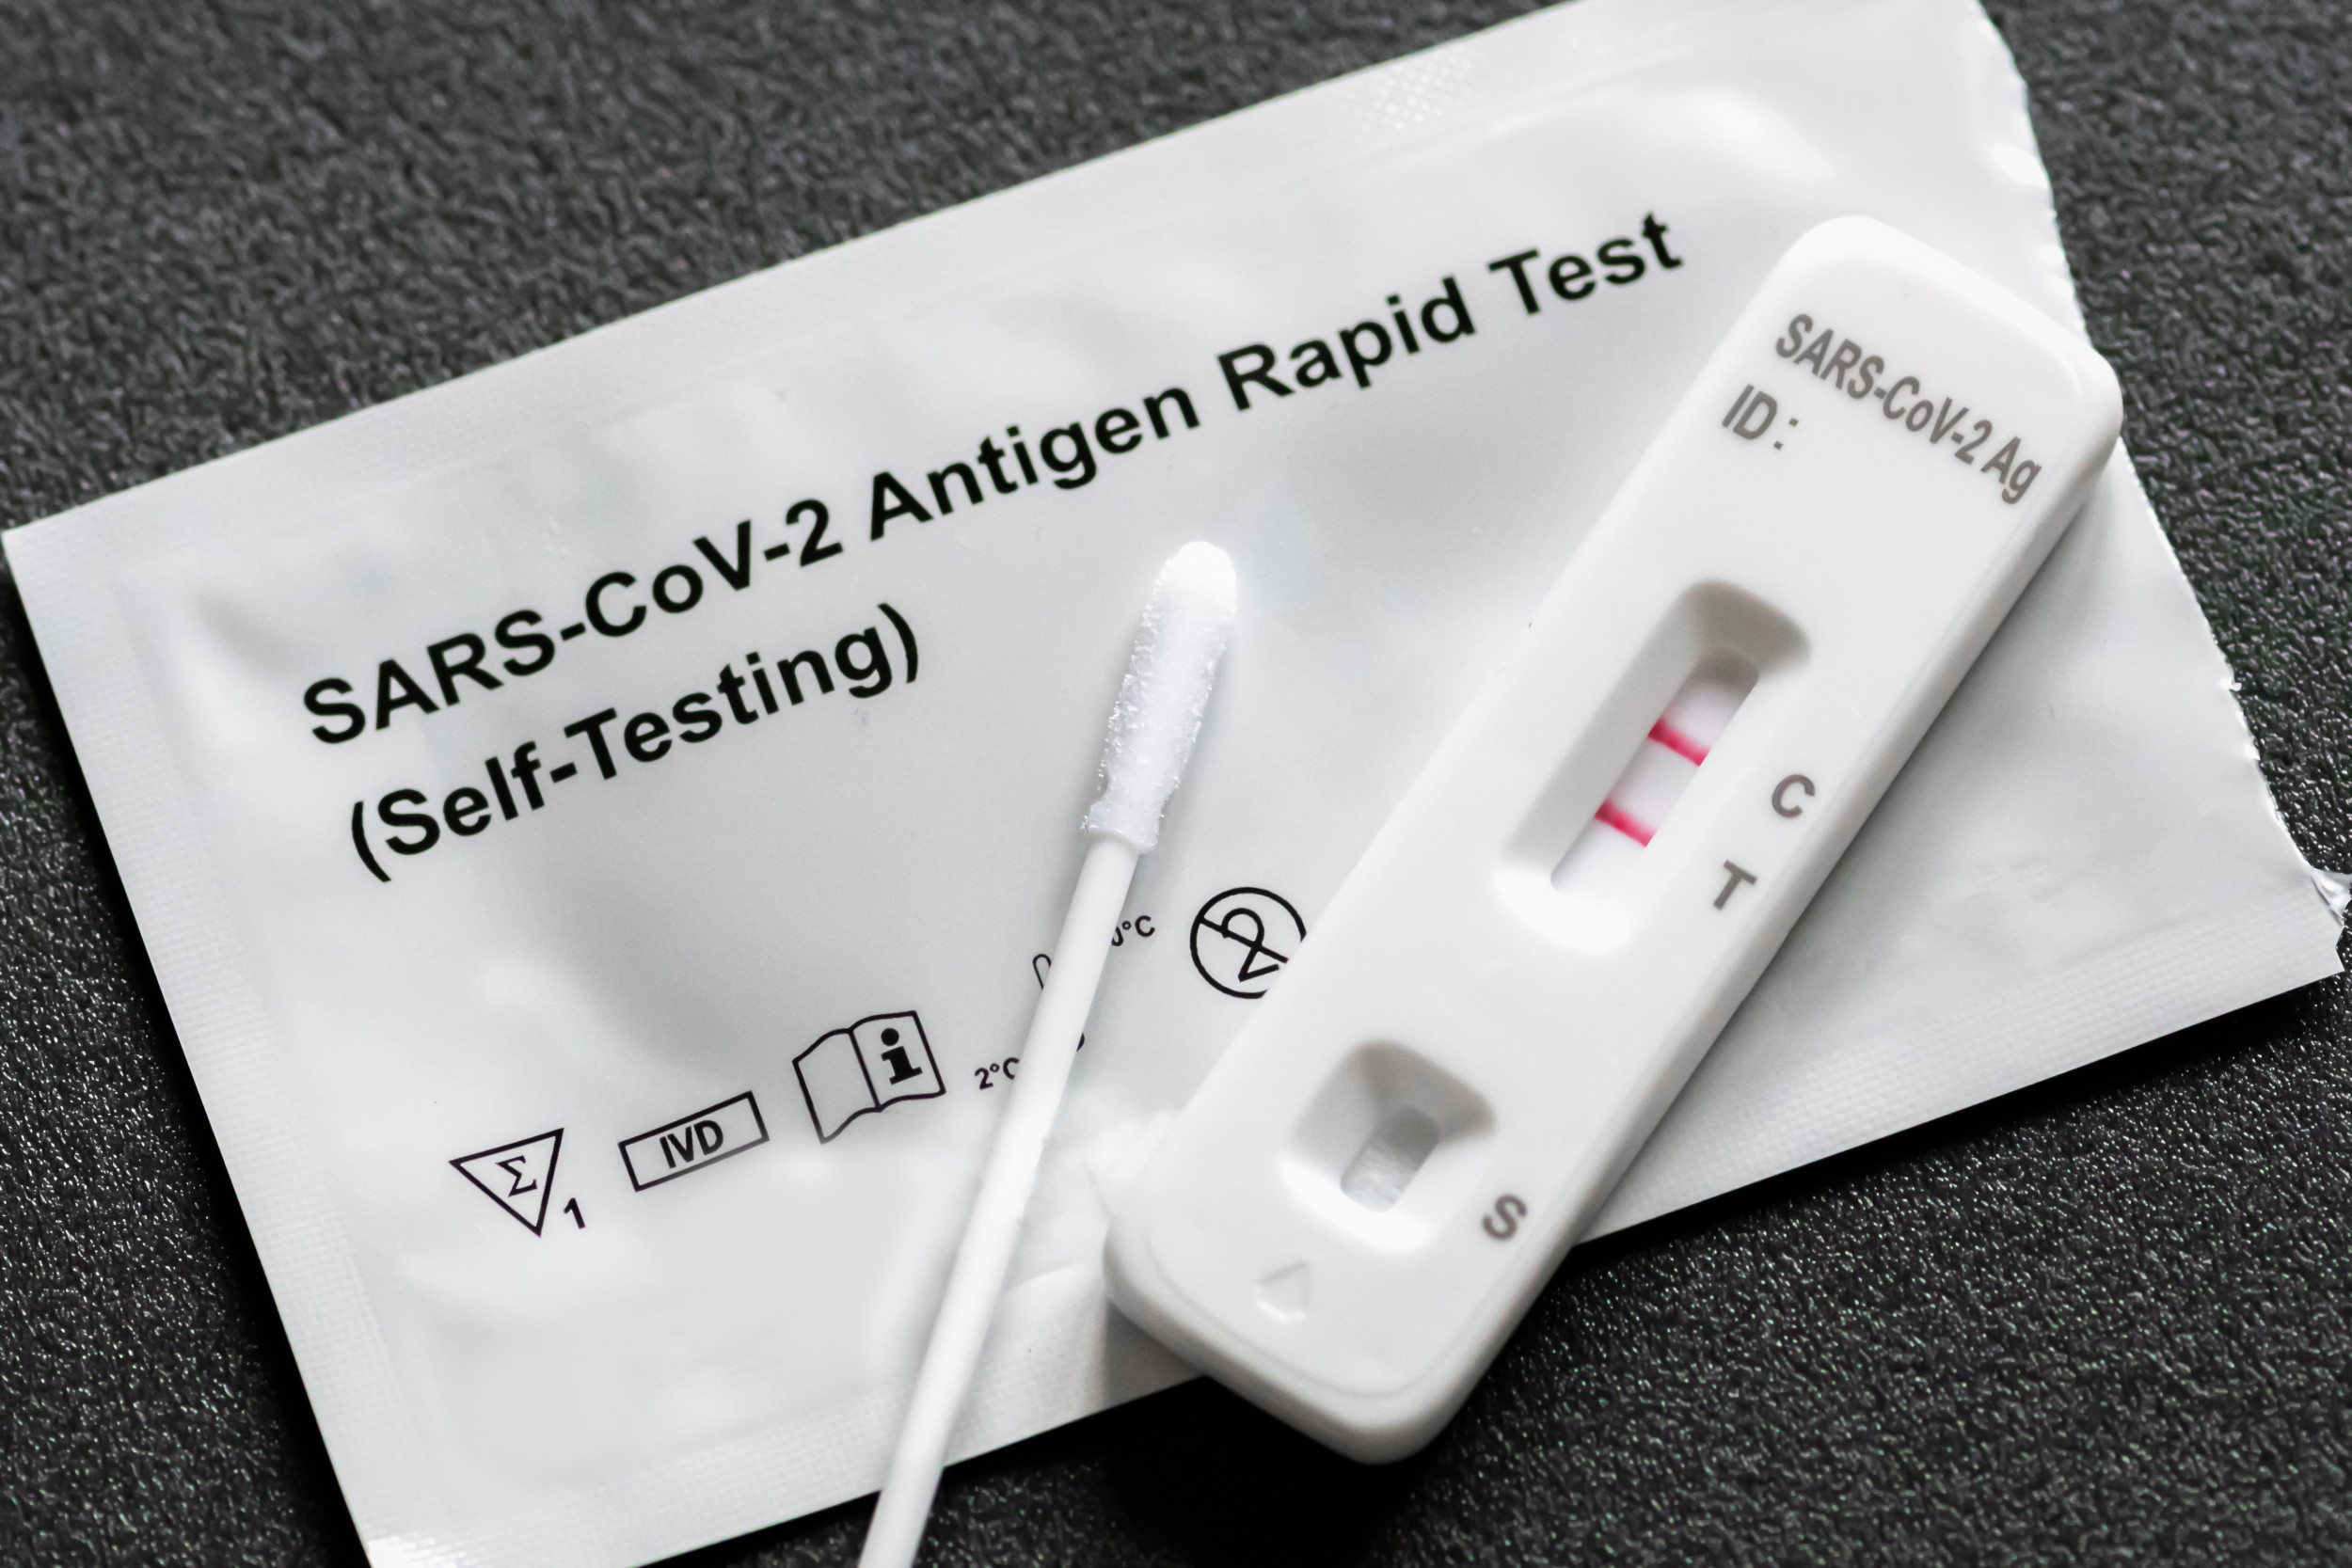
Jan. 19, 2024 – The familiar symptoms are back again – a runny nose, coughing, aches, congestion, and maybe a fever. When the at-home COVID-19 test comes back negative, you head to the doctor to see if they can figure out what you’ve caught. At the doctor, though, the typical COVID and flu tests also come back negative. It could seem like a new mysterious respiratory illness is making the rounds.
Instead, several typical respiratory viruses seem to be peaking at once. Doctors are reporting high levels of COVID, the flu, and respiratory syncytial virus (RSV), as well as other “flu-like illnesses” that cause similar symptoms, such as the common cold, other coronaviruses, and parainfluenza viruses (which cause typical respiratory symptoms such as a fever, runny nose, coughing, sneezing, and a sore throat).
“Respiratory viruses are still very high right now, as you would expect at this time of year,” said Brianne Barker, PhD, who researches viruses and the body’s immune response as an associate professor of biology at Drew University in New Jersey. “Also, a fair number of patients seem to have multiple infections at once, such as flu and strep, which may cause confusion when patients consider their symptoms.”
First-Aid Kit for Flu, Cold, and COVID-19

1/12
Pain Relievers
To help lower a fever and get some relief for uncomfortable body aches, be sure to have acetaminophen, naproxen, or ibuprofen on hand. However, if you have hypertension, kidney disease, or diabetes, you should be careful using NSAIDs. Aspirin also works, but don’t give it to kids. Aspirin is linked to a rare but life-threatening condition called Reye’s syndrome in children.

2/12
Other Meds
Decongestant nose sprays or drops with phenylephrine or pseudoephedrine as the active ingredient take down swelling in your nose and help you breathe better. Decongestant balms you rub on your chest can also help open airways. Cough medicines or drops with dextromethorphan help with a dry cough, while those with guaifenesin can soothe a wet cough.

3/12
Hand Sanitizer
For the best germ-killing power, wash your hands with soap and water whenever you can. But it’s a good idea to have a hand sanitizer with at least 60% alcohol around, too. Keep it by the bed when you’re sick, and use it after you cover a cough or blow your nose. Caregivers can grab a squirt, too, after checking a temperature or feeling a forehead.
tissue box

4/12
Tissues
Coughs and runny noses can be features of colds, flu, and COVID-19. Keep tissues on hand so you can contain those germs that you’re hacking and sneezing. Use a tissue to cover coughs and sneezes. Throw tissues away promptly, and then wash or disinfect your hands.
man looking at thermometer

5/12
Thermometer
Even if you’re not feeling feverish, it’s a good idea to track your temperature during an illness, so you have a good read on your body. You also need a thermometer in case your temperature spikes and you need to report it to a doctor.

6/12
Mask
It’s best to keep your distance from other people when you have a virus, but if you share a household or need to go to the doctor’s office, a mask that covers your nose and mouth is a must for keeping your germs to yourself.

7/12
Disinfectant Spray
The common cold, the flu, and COVID-19 are all airborne illnesses. That means they travel through droplets from your nose and mouth. When you’re sick, wipe down areas you touch so you lower the chances of passing the virus on to others.

8/12
Lots to Drink
Your body loses a lot of fluids when you’re sick because of fever sweats, a runny nose, and coughing. Water is good, but be sure to stock up on other kinds of drinks, too. Broth, warm tea, or drinks with electrolytes can all be good for hydration.

9/12
Humidifier
A cool-mist humidifier blows tiny droplets of water into the air to help keep your airways moist and ease stuffiness and dry coughing. Viruses are less likely to survive in humid air than in dry air, so it may help lessen the spread of your sickness, too.

10/12
Zinc Lozenges
While zinc lozenges won’t treat symptoms, studies show that if you start popping them at the first sign of cold or flu symptoms, they can cut the length of your illness by up to 40%.
pulse oximeter

11/12
Pulse Oximeter
A pulse oximeter is a small device that clips to your finger and reads how much oxygen is getting to your red blood cells. You don’t need one for a cold or the flu. But if you’re COVID-19-positive and having symptoms, it could help you keep tabs on how you’re doing. Normal oxygen levels are between 95% and 97%. Readings lower than that mean it’s time to call a doctor.
emergency sign

12/12
When to Go to Urgent Care
It’s important to know when your home remedies aren’t enough anymore. See a doctor right away if you or a loved one have trouble breathing, chest pain, confusion, trouble waking up, seizures, severe muscle pain, fever over 103 F, or aren’t peeing.
Next
Medically Reviewed by Gabriela Pichardo, MD on November 18, 2022

So, what should you do? Wear a mask in public if you think you have symptoms, Barker said. Stay home if you feel sick, particularly if you have a fever over 100.4 F and signs of contagiousness, such as chills and muscle aches. Antiviral medications – such as Tamiflu for the flu and Paxlovid for COVID – may help if you catch it soon enough, but otherwise, it’s most important to stay hydrated and rest at home.

“The big picture is we’re in the heat of respiratory virus season, and the big player at the hospital right now is the flu, which seems to be superseding everything else,” said Dhaval Desai, MD, director of hospital medicine at Emory Saint Joseph’s Hospital in Atlanta. “I’m not sure if certain viruses are more aggressive or different this year, so it’s hard to say exactly what’s going on, but we’ve certainly seen an uptick since mid-December, and it hasn’t stopped.”

What Are the Latest Trends?
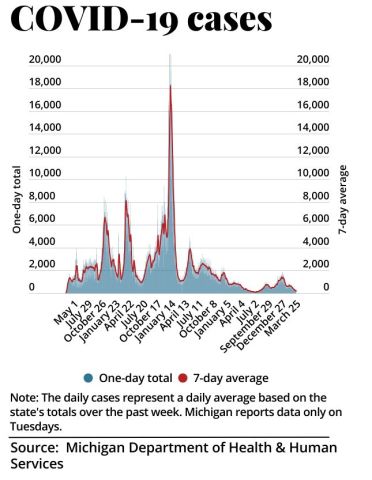
The current COVID-19 surge appears to be at the highest point since the Omicron variant infected millions in December 2022, according to the CDC's COVID wastewater data. Test positivity appears to be stabilizing after increasing since November, the CDC’s COVID Data Tracker shows, though the rate was still high at 12.7% positivity during the first week of January.
At that time, COVID-19 emergency department visits began declining, though hospitalizations were still on the rise and deaths were up 14.3% from the previous week. As of Jan. 6, the JN.1 variant is driving most of the spread, accounting for 61.6% of COVID-19 cases in the U.S., according to CDC variant data.
“COVID doesn’t seem as bad right now as in the days of Omicron, but the problem is that it’s tough to compare because COVID cases aren’t reported in the same way as before, and we don’t have that state data,” said Bernard Camins, MD, an infectious disease specialist and medical director of infection prevention at Mount Sinai Health System in New York City.

The good news, he said, is that hospitalization rates are lower than last year, considering the number of people getting infected, “so there’s some immunity to it now.”
“The other good news is we have treatments for COVID, such as Paxlovid, that most people can take as long as they talk to their doctor as soon as possible after they get infected.”

Cold vs. Flu

00:0000:00


ABOUT TRANSCRIPT
Cold vs. Flu
Cold and flu viruses share certain symptoms. Here’s how to tell the difference.

Influenza rates, which dropped during the height of the COVID pandemic, appear to be back at typical levels, Camins said. This flu season started earlier than usual in 2023 and will likely peak in the next few weeks. The CDC’s FluView shows that test positivity – now at 14% – is increasing, and hospitalizations and deaths are trending upward as well.
Similarly, the CDC’s national trends data for RSV shows that cases rose as high as last year’s peak in recent weeks but appear to be declining now, especially in the Northeast and South.

Other viruses are circulating as well, such as adenovirus, which can cause a cold, sore throat, diarrhea, pinkeye, and other symptoms. Parainfluenza viruses peaked in late November and saw another jump at the end of December. Rhinoviruses, which cause the common cold, also returned to normal peak levels alongside the flu this season, Camins said.
“I haven’t gotten sick since 2021 and recently got rhinovirus, and it went through my household. The symptoms weren’t severe, but I still have a lingering cough,” he said. “The trick is that people weren’t getting exposed in previous years due to masking and other precautions, but now people are getting exposed to many of these viruses.”
What Should We Expect Next?
Peak respiratory virus season will likely continue throughout January and February and then begin to fade as the weather warms up, allowing for outdoor activities, better ventilation, and higher humidity.

“One of the reasons why we see so many infections at this time of year is related to humidity, when the respiratory droplets containing these viruses stay in the air longer and the immune response in our nose actually works less well in dry air,” Barker said. “Evidence indicates that having increases in humidity can help get rid of some of the viruses in the air and help our immune response.”
In the meantime, Barker suggests taking precautions, stocking up on at-home tests, and staying home when you're sick. She recently recovered from an upper respiratory infection and has decided to wear a mask in public places again. She tested negative on every possible test at her doctor’s office and doesn’t want to repeat the experience.
“It reminded me how much I don’t enjoy having an infection,” she said. “I’m willing to wear a mask at the grocery store if I don’t have to go through that again. I’m taking care of myself and others.”
In addition, don’t hesitate to get tested, Desai said, especially if an antiviral could help. After getting a respiratory virus in November, he had a high fever and sweating and decided to go to his doctor. He tested positive for influenza A, or H1N1, which the CDC’s FluView says was the most frequently reported flu strain at the end of December.

“It kicked me harder than other illnesses in recent years, but I did take antivirals, and it was out the door in about 4 days,” he said. “My mom, who is immunocompromised and in her 70s, also got it but took an antiviral even sooner and got over it in about 24-36 hours.”
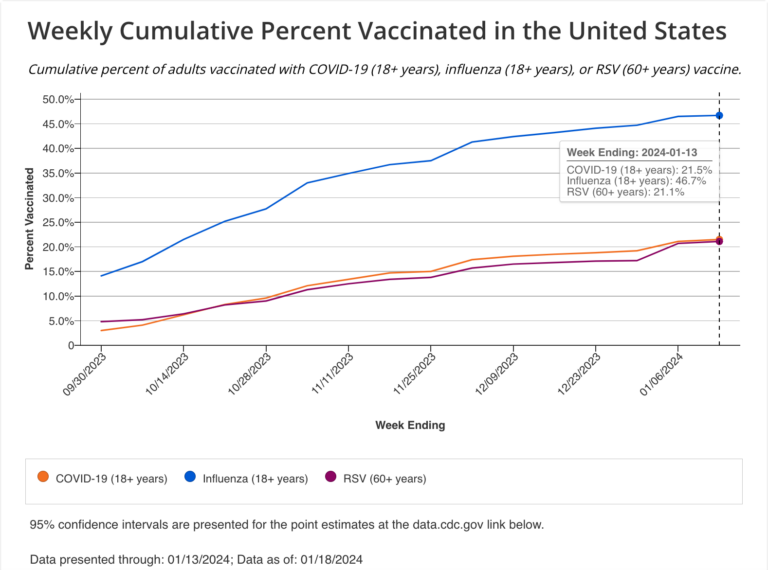
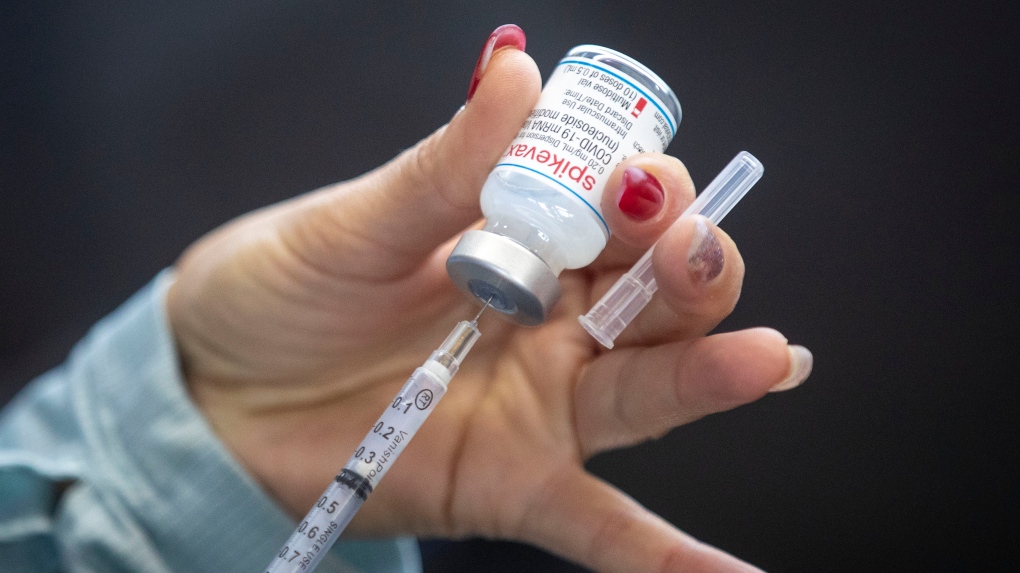
For the next couple of months, it’s also not too late to get vaccinated against the most prevalent viruses, especially COVID, the flu, and RSV. The most vulnerable groups, such as young children and older adults, could especially benefit from vaccination, Camins said.
“With RSV, for instance, there are vaccines for pregnant women to protect their infants,” he said. “And although we don’t have great data to say whether the current COVID vaccine is protective against infection, we know it still protects against severe disease and death.”
As 2024 continues, experts said they’re looking forward to more effective at-home tests for COVID and the flu, better flu vaccines, and new research on the body’s immune response to these respiratory viruses.
“Disease prevention is key, irrespective of what’s surging and what we’re dealing with right now,” Desai said. “Think about your risk factors and what you’re doing overall this year for your health and wellness – whether routine physical exams or cancer screenings, based on your age. There’s power in staying healthy and advocating for ourselves when we’re feeling well.”
 

The3Amigos

Senior Member
Joined
Dec 3, 2023
Messages
7,604
Likes
866
Country flag
This guy went to the same university and the same department as I did.


The3Amigos

Senior Member
Joined
Dec 3, 2023
Messages
7,604
Likes
866
Country flag

COVID by the Numbers: Winter 2024
By Team Verywell Health
Updated on January 26, 2024
Fact checked by Marley Hall

Print
people looking at charts

Joshua Seong / Verywell

The Verywell COVID-19 tracker updates monthly. The data reflects what the Centers for Disease Control and Prevention (CDC) and World Health Organization (WHO) continue to report after the end of the COVID-19 public health emergency.
For the most current information about COVID where you live, check your state's public health department website.
What is the CDC Tracking?
  • The Centers for Disease Control and Prevention (CDC) is no longer tracking COVID-19 cases in the United States. The CDC is reporting hospitalizations and deaths related to COVID, as well as vaccinations. For the most up-to-date information about COVID cases where you live, check with your state's public health department.1
Throughout the COVID-19 pandemic, states reported data to the Centers for Disease Control and Prevention about the number of COVID cases they had. Over time, states stopped reporting this info and with the end of the public health emergency in the United States, the CDC dropped its case counting as part of its COVID Tracker.

Instead, the CDC has continued to look for trends in hospitalizations and deaths related to COVID as a way to measure the activity of the virus in the U.S. The CDC is also tracking how many people are getting vaccinated against COVID.

For the most current COVID case counts where you live, check with your local public health department.

COVID Hospitalizations
Instead of tracking COVID cases, the CDC is keeping an eye on hospitalizations related to COVID. The CDC can get an idea of how COVID cases might be increasing in different states (even by individual county) by looking at how many hospital visits are related to the virus.


In the last week, the CDC reported a total of 326,607 new hospital admissions related to COVID in the U.S. That was a -14% change (decrease) from the previous week.

You can use the CDC's County Check tool to get more info about the rates in your community.

COVID Death Rates by State
The CDC has reported 1,172,229 deaths in the U.S. since tracking started in January 2020. However, as with COVID case counts, the CDC is no longer tracking deaths like it used to.

Now, the CDC shows provisional COVID deaths reported to the National Center for Health Statistics (NCHS) National Vital Statistics Surveillance (NVSS).

As of January 26, 2024, the CDC reported a -7.5% change (decrease) in deaths attributed to COVID.

Does the CDC Track COVID Vaccination Rates?
The CDC provides estimates for how many people in the U.S. have received COVID vaccines, including booster doses. Your state's public health department may also be tracking COVID vaccinations.

The CDC reports the following percentages of people in the U.S. who are up to date with the most recent COVID vaccine:

  • Children: 8%
  • Adults: 21.4%
  • Pregnant persons: 11.9%


To learn more about how COVID data was gathered and tracked during the pandemic and what it means for you, read through the FAQ below.

FREQUENTLY ASKED QUESTIONS
  • How does the CDC get COVID data?
    Throughout the pandemic, states and the U.S. territories reported certain COVID information to the CDC. In the beginning, data were reported daily. Over time, the reporting frequency decreased to weekly updates. By early 2023, some states had stopped updating the CDC with COVID data.
    A lot of this data was collected and reported at the county level. Even when there is not a pandemic, there are certain infectious diseases that states always need to report, meaning that most public health departments are already aware of the need to collect and share data with the CDC.
    That said, the COVID pandemic demanded more from state health departments, and having to collect and report data on COVID cases, deaths, and transmission was not easy.
    For much of the pandemic, all 50 states were reporting to the CDC, as well as specific jurisdictions. For example, New York City reported its own data separate from New York state.
  • What information did states report to the CDC?
    States told the CDC about how many cases of COVID they had in the state, as well as how many people had died from COVID. States reported the total number of cases since they started keeping track (which included both confirmed and probable cases—though not all jurisdictions reported these figures) and the number of new cases and deaths reported within the last seven days.
    Information about COVID testing, hospitalizations, and the number of people who had recovered was also reported. In some cases, the data was presented as a percentage. In other cases, you might see the data displayed as “the rate per 1,000 people” within a given timeframe.
    Since each state is not the same size, looking at the number of cases or deaths relative to how many people live in the state tells you more about the spread of the virus than simply looking at the raw data. A high number of cases in a state with a small population would mean something different than the same number of cases in a state that is three times as big.
    States also reported some information that was not accessible to the public; the restricted data contained more specific fields that could potentially compromise patient privacy. This data was more meant for public health officials and researchers.
    Some states provided data about how communities had been affected by COVID-19. For example, the CDC displayed data that showed how often people were going out in certain parts of the country and related this data on mobility to the level of virus transmission in those areas during specific times.
    Some states also provided information about specific populations, such as healthcare workers and people who are pregnant.
  • How accurate is the data?
    The numbers reported to the CDC are as accurate as a state can provide, though they can change. While the numbers were initially updated daily, there were sometimes lags over the weekend or over the holidays. Some states had backlogs of tests from weeks ago, meaning that the data reported was a little behind the current situation.
    The totals that were reported sometimes included probable (or suspected) cases and deaths that had not been confirmed. However, some places did not report suspected cases or deaths—only those that have been confirmed. Later on, it may have turned out that those cases were not related to COVID after all, in which case those cases would be dropped from the report.
    It’s also important to keep in mind that there are people who get COVID and do not have symptoms. If they aren’t sick and do not realize that they were exposed, they are not likely to get tested. Unless states had the ability to do more widespread testing that included people without symptoms, it’s likely that they were undercounting the total number of COVID-19 cases because asymptomatic people were not included if they did not get a test.
    In some circumstances, people who go to the emergency room for symptoms of COVID might be diagnosed with another illness, like the flu or pneumonia. Data on ER visits that could be related to COVID-19 were not reported by all jurisdictions, however.
    The data that was reported did not look the same coming from all the different hospitals in the U.S. because healthcare systems do not code diagnoses in the same way. In some cases, the coding classification changes which could affect whether a case is counted as a COVID case or not.
    Similarly, deaths from COVID might have been missed if something like pneumonia was listed as the cause of death on a person’s death certificate or in a provider's documentation rather than the death being attributed to COVID.
    There were also situations where a person who was sick or had been exposed to someone with COVID did not seek care or did not have access to tests.
    It’s also possible that a state counted cases or deaths that actually “belong” to another state’s totals. This can happen if someone lives in one state, travels to another, and gets COVID while they are traveling.
    Due to these factors, it’s normal for case and death numbers to change—in fact, they are changing often.
  • What can I tell about COVID in my state by looking at the numbers?
    There are several pieces of data to consider if you want to understand the COVID situation where you live. While the most straightforward numbers are the total case and death counts, these figures don’t give you the full story. When you’re looking at statistics, context is important.
    It can be more helpful to look at how the number of cases compares to how many tests your state is doing. If your state is not testing many people, the number of positive cases will not really reflect how many people in your state likely have COVID.
    It’s also important to remember that the total numbers—both in terms of testing and confirmed cases—are likely missing people who are asymptomatic. Remember that a person can have COVID-19 without getting sick, but they can still spread it to others without realizing it.
    Additionally, looking at the totals from the beginning of the pandemic to the present doesn’t tell you the same information as looking at 7-day averages. You can get a better sense of how fast cases and deaths are rising by looking at how the numbers have changed in the last week as opposed to nearly a year.
    If you’re looking at the number of deaths, remember that those numbers are slower to change than the total number of cases. There can be a “lag” between a rise in cases and a rise in hospitalizations or deaths because it takes some time for people to get sick.
  • How will new variants affect COVID numbers?
    New variants of the COVID virus are always emerging, as it's natural for viruses to change over time. Researchers follow new variants closely to see if the changes in the viruses may make them more of a threat—for example, they might become better at spreading or resisting vaccines and treatments. Some changes can also make the virus more likely to make people very sick if they catch COVID.
    Learn More: Why BA.2.86 Stands Out From Other COVID Variants
 

The3Amigos

Senior Member
Joined
Dec 3, 2023
Messages
7,604
Likes
866
Country flag
People who test positive for COVID-19 can still go to work, as long as they don't have symptoms


KumarG

Regular Member
Joined
May 31, 2017
Messages
130
Likes
338
Country flag
Isn't the scientific name for this virus Chinavirus?
 

Global Defence

New threads

Articles

Top