BRICS, E7 Economies, and IBSA

santosh10

Senior Member
Joined
Oct 5, 2014
Messages
1,666
Likes
177
The BRICS

BRICS is the acronym for an association of five major emerging national economies:Brazil, Russia, India, China and South Africa. The grouping was originally known as "BRIC" before the inclusion of South Africa in 2010. :thumb: The BRICS members are all developing or newly industrialised countries, but they are distinguished by their large, fast-growing economies and significant influence on regional and global affairs; all five are G-20 members. As of 2013, the five BRICS countries represent almost 3 billion people, with a combined nominal GDP of US$16.039 trillion, and an estimated US$4 trillion in combined foreign reserves. Presently, South Africa holds the chair of the BRICS group, having hosted the group's fifth summit in 2013. The BRICS have received both praise and criticism from numerous quarters.


BRICS - Wikipedia, the free encyclopedia


=> The E7

The E7 is a group of seven countries with emerging economies. The E7 are predicted to have larger economies than the G7 countries by 2020. The term was coined by the PricewaterhouseCoopers in the Stern Review report, which was published on 30 October 2006. The E7 represents the seven major emerging economies.


E7 (countries) - Wikipedia, the free encyclopedia
 

santosh10

Senior Member
Joined
Oct 5, 2014
Messages
1,666
Likes
177
IBSA [India, Brazil & South Africa]
April 24, 2013

IBSA is a unique Forum which brings together India, Brazil and South Africa, three large democracies and major economies from three different continents, facing similar challenges. All three countries are developing, pluralistic, multi-cultural, multi-ethnic, multi-lingual and multi-religious nations.


The idea of establishing IBSA was discussed at a meeting between the then Prime Minister of India and the then Presidents of Brazil and South Africa in Evian on 2 June 2003 on the margins of the G-8 Summit. The grouping was formalized and named the IBSA Dialogue Forum when the Foreign Ministers of the three countries met in Brasilia on 6 June 2003 and issued the Brasilia Declaration.

Cooperation in IBSA is on three fronts: first, as a forum for consultation and coordination on global and regional political issues, such as, the reform of the global institutions of political and economic governance, WTO/Doha Development Agenda, climate change, terrorism etc.; second, trilateral collaboration on concrete areas/projects, through fourteen working groups and six People-to-People Forums, for the common benefit of three countries; andthird, assisting other developing countries by taking up projects in the latter through IBSA Fund

The success of IBSA reflects an important demonstration effect. It demonstrates, most vividly, the desirability and feasibility of South-South cooperation beyond the conventional areas of exchange of experts and training. IBSA success in contributing to discourse on global issues also shows the importance of engaging with the countries of the South.


Organizational Structure

Joint Working Groups

Joint Working Groups to promote sectoral cooperation have been established. There are 14 Joint Working Groups in areas, Transport; Health; Education; Defence; Science & Technology; Trade & Investment; Culture; Agriculture; Energy; Public Administration and Governance, Revenue Administration, Human Settlement, Environment and Social Development. These Working Groups meet as per their respective plans.

People-to-People Forums
There are six People-to-People Forums under IBSA. These are, Parliamentary Forum, Women's Forum, Academic Forum, Local Governance Forum, Business Forum, and Editors' Forum. There is also a Tri-nation Forum on MSME.

Focal Points
Senior Officials from the Foreign Offices of the three countries dealing with IBSA are the designated Focal Points; Secretary (West), assisted by Joint Secretary (MER), Ministry of External Affairs, is the IBSA Focal Point for India. Focal Points meet once a year for a standalone meeting and also meet prior to the Trilateral Commission.

Trilateral Commission
The Brasilia Declaration established a Trilateral Commission at the level of Foreign Ministers. The Commission meets regularly; the first meeting of the Trilateral Commission was held in New Delhi on 4 - 5 March 2004. The 7th meeting of the Commission was also held in New Delhi on 8th March, 2011; 8th Meeting is due in South Africa. In addition, Foreign Ministers meet regularly before every IBSA Summit as well as on the sidelines of UNGA in New York.

Summits

IBSA [India, Brazil & South Africa]
 

santosh10

Senior Member
Joined
Oct 5, 2014
Messages
1,666
Likes
177
Budget Deficit

19 Brazil +2.90 2011 est. :ranger:
36 Russia 0.40 2011 est.
58 Indonesia -1.20 2011 est.
68 Turkey -1.60 2011 est.
71 China -1.80 2011 est.
91 Mexico -2.40 2011 est.
132 World -4.20 2011 est.
149 India -5.00 2011 est. :ranger:
154 South Africa -5.20 2011 est.

178 Pakistan -7.00 2011 est.

190 United Kingdom -8.80 2011 est.
191 United States -8.90 2011 est.
193 Greece -9.60 2011 est.
198 Ireland -10.10 2011 est.

Budget surplus (+) or deficit (-) 2012 country ranks, By Rank
 
Last edited:

santosh10

Senior Member
Joined
Oct 5, 2014
Messages
1,666
Likes
177
List of countries by credit rating

here, we find only China looking impressive among all the E7+SA at A+, rest are mostly yellow at "BBB" :ranger:


Dark Green - AAA
Light Green - AA
Celery - A
Yellow - BBB
Orange - BB
Red - B
Dark Red - CCC

Credit rating - Wikipedia, the free encyclopedia
List of countries by credit rating - Wikipedia, the free encyclopedia

=> also, its simple that there are very less political risks, easy financing, easy to do business etc, along with pretty good infrastructure we find in the developed countries. so there is no reason why can't they have 'triple A' rating, as compare to Emerging BRICS, who are in Yellow color, BBB, in the picture as below, except China....

but if we find Spain, Italy, Portugal, Ireland, Cyprus, Greece etc in Yellow in this picture then its all about the fact that they have got the 'new risk' of High Debts. the same we find in case of US, which is loosing its color too, less green it is now at AA+ only now, because of high debts of this newly introduced risk in world

and in fact its mainly because of poor Infrastructure assets in emerging economies, why they are down to the developed economies in these ratings, as i find.....

as above, the OECD economies losing their credit rating because of high debts, a new risk we find in world now. here, few factors governing these ratings is as below: :thumb:

A.M. Best defines country risk (read the methodology) as, "the risk that country-specific factors could adversely affect an insurer's ability to meet its financial obligations." Country risk is evaluated and factored into all A.M. Best ratings. As part of evaluating country risk, A.M. Best identifies the various factors within a country that may directly or indirectly affect an insurance company.

Best's Credit Ratings & Analysis
 
Last edited:

santosh10

Senior Member
Joined
Oct 5, 2014
Messages
1,666
Likes
177
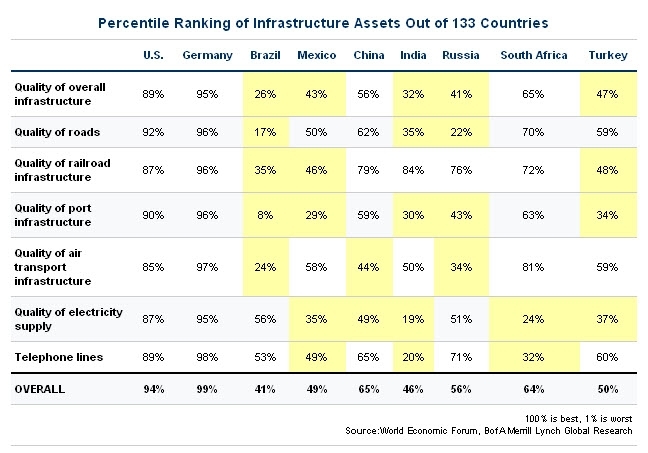
here, the reports like as below generally have variations from 10% to 40%, but we have something in this regard so i think it may have a place here too. here we clearly see that Brazil and India have to spend much more on the Infrastructure :ranger:

here we find a good reason to see China in light green colors in the above Credit Rating :thumb:


China, which accounts for more than half of that $6 trillion estimate, ranks far above emerging peers in terms of infrastructure at the 65th percentile.

Emerging Markets Are Going To Spend A Massive $6 Trillion On Infrastructure In The Next Three Years - Business Insider
 
Last edited:

santosh10

Senior Member
Joined
Oct 5, 2014
Messages
1,666
Likes
177
India needs to raise infrastructure spending to 10% of GDP: IDFC Projects
May 5, 2012

MANILA: India needs to raise infrastructure spending to 10 per cent of GDP to achieve and sustain economic growth target of 9 per cent in the coming years.

"In order to sustain growth targets, this (investment in infrastructure) would need to increase further to over 10 per cent of GDP by 2017," IDFC Projects Ltd Managing Director Pradeep Singh said in a presentation at the annual meeting of Asian Development Bank here.

India's infrastructure spending is 8 per cent of the Gross Domestic product, as against China's 9 per cent, he said. The country's GDP was $1.4 trillion at the end of March 2011.

Acknowledging that India has a long way to go in terms of meeting its infrastructure requirements, Singh said the 12th Five Year Plan (2012-17) envisages $1 trillion investment in the sector.

Of the total targeted investment, private sector is expected to invest $500 billion - with around $350 billion through debt and $150 billion of equity over next five years.

Domestic funding sources, Singh said, will not be sufficient to meet these needs.

However, during the 11th Plan period ended in March, investment in infrastructure sector fell short of its target of $500 billion.

Total investments during the past five years was about $425 billion, Singh said.

Despite the aggressive growth in last five years, India's basic infrastructure ranked 86th in Global Competitive Report-2010 by World Economic Forum, he pointed.

Projecting India as investment destination, State Bank of India Chairaman Pratip Chaudhuri said, in a separate presentation, that Qualified Foreign Investors were allowed to directly invest in Indian equity market in January.

Besides, he said, the overall FII investment limit in government securities and corporate bonds has been enhanced to $60 billion.

Chaudhuri also said India has a well regulated banking system, with 98 per cent of the banks fully computerised.

India needs to raise infrastructure spending to 10% of GDP: IDFC Projects - Economic Times
 

santosh10

Senior Member
Joined
Oct 5, 2014
Messages
1,666
Likes
177
World Competitiveness Yearbook 2012:


The most competitive nations in Europe are Switzerland (3), Sweden (5) and Germany (9), which have export-oriented manufacturing and fiscal discipline. Meanwhile, Ireland (20), Iceland (26) and Italy (40) look better equipped to bounce back than Spain (39), Portugal (41) and Greece (58), which continue to scare investors.

Emerging economies are not yet immune to turmoil elsewhere. China (23), India (35) and Brazil (46) have all slipped in the rankings, Russia (18) climbed only one place. All Asian economies have declined apart from Hong Kong (1), Malaysia (14) and Korea (22). Latin America also had a tough year, with every nation falling except Mexico (37). :ranger:

World Competitiveness Yearbook 2012: Hong Kong, US and Switzerland most competitive of 59 nations; Ireland rises to 20th ranking
 

santosh10

Senior Member
Joined
Oct 5, 2014
Messages
1,666
Likes
177
Most Expansive Places of World
15-10-2012

5th Moscow $17,566 per sq.m.

7th Singapore $16,350 per sq.m.

10th Mumbai $11,306 per sq.m. :coffee:

12th Sydney $8,774 per sq.m.

20th Shanghai $6,932 per sq.m.

29th Istanbul $4,569 per sq.m.

47th Dubai $3,393 per sq.m.

54th Bangkok $2,996

68th Kuala Lumpur $2,182 per sq.m.

73rd Jakarta $,2099

World's most expensive cities


=>
Office rentals in Mumbai and Delhi continue to be among the highest in the world, beating the likes of New York, Washington or Shanghai despite a depreciating rupee. Renting office space in Mumbai and Delhi costs over $65 and nearly $73 per square meter a month, while the same costs $63 in New York $48 in Washington and $41 in Shanghai, property consultancy firm DTZ said in a report.

Mumbai, Delhi office rentals top Shanghai, New York - Economic Times
=>
78 skyscrapers approved in Mumbai in one day

Mumbai: On Saturday, High-rise Committee chairman Shafi Parkar and BMC commissioner Sitaram Kunte approved development proposals for 78 skyscrapers " buildings above the height of 70 metres. Saying that Mumbai has only 30 buildings of 100 metres height or more, while Shanghai has 200 and New York close to 500, Mr Kunte made a case for buildings to get taller to circumvent the city's lack of space.

http://-----------/threads/78-skyscrapers-approved-in-mumbai-in-one-day.188110/
 

santosh10

Senior Member
Joined
Oct 5, 2014
Messages
1,666
Likes
177
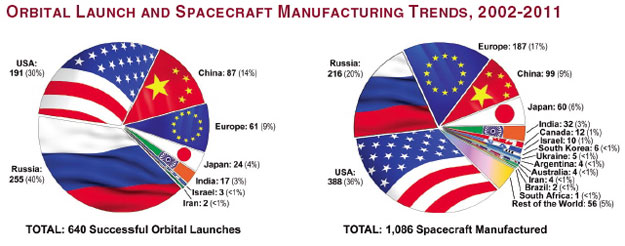
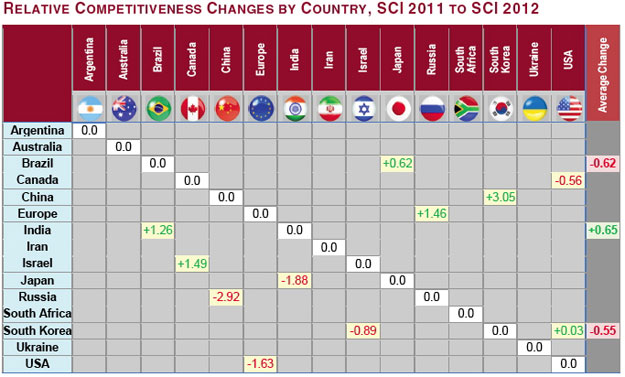
Futron Releases 2012 Space Competitiveness Index

Futron has released its 2012 Space Competitiveness Index marking the 5th anniversary of the yearly publication. According to the report, the United States remains the overall leader in space competitiveness but is seeing a decline for the 5th year in a row.

The decline is attributed to enhanced capabilities in other countries while the U.S. is undergoing a transition with "significant" uncertainty.

New to the index this year are emerging space nations Argentina, Australia, Iran, South Africa and the Ukraine.

Four distinct tiers have emerged. The first tier has the U.S., Europe, and Russia. The second tier China, Japan, India, and Canada. The third tier South Korea, Israel, and Brazil. And the fourth tier Argentina, Australia, Iran, South Africa and the Ukraine. :ranger:

Futron says the top two tiers remain dynamic but have shown some stabilization while the bottom two tiers are subject to intense competition, with very small gaps in the competitive rankings.


China gained the most competitiveness basis points in 2012, followed by Europe, India, and Israel. Japan lost the most basis points, followed by Canada, South Korea, and the United States. When compared against the larger group of 15 nations, Brazil falls to 11th place, just below Australia.

As has been noted before International collaboration is increasingly taking shape as a concerted space competitiveness strategy, especially among smaller actors.

Here's a list of some of the findings by country:

- Argentina is adapting its satellite manufacturing sector for the international marketplace, exploring both commercial and government-to-government deals. It stands to benefit from increased investment in spacecraft subcomponents.

- After more than a decade of dormancy, Australia is back. The government is refreshing its national space policy segment-by-segment, focusing on space not only a driver of innovation and expertise, but also for its benefits to Australian society.

- Brazil has begun to re-examine its national space priorities, increased funding, expanded its partnerships, and laid plans for a new launch vehicle. It remains to be seen whether these steps will keep Brazil ahead of regional counterparts that are also emerging onto the space scene.

- Canada retains a skilled space workforce, but delays in space policy refresh and implementation are significantly offsetting these competitive advantages.

- China performed a record number of launches in 2012, surpassing the United States for the first time, while increasing investment in technical education programs and civilian research institutes.

- Europe's integrated approach is complemented by the rise of new national space agencies across the continent--from the United Kingdom to the Czech Republic to Estonia--as well as more assertive space export financing.


- India is enhancing its space-related technical education, while gradually progressing toward a completely self-reliant set of next generation launch vehicles.

- Iran has made faster progress than any other newly emergent space nation. The tenor of Iran's space program--civilian or military--will hinge on geopolitics. Other international actors have substantial power to influence the future focus of the Iranian space program.

- Israel, despite funding increases, remains challenged by its lack of domestic industry scale, and has difficulty sustaining a commercial space presence in global markets.

- Japan, despite ongoing benefits from its policy reforms, is losing competitive ground relative to most other actors, and can benefit from a greater focus on commercializing its industrial base.

- Russia's remains the world's launch leader, and promises to retain that role in the near term thanks to its vital role in transporting astronauts and cargo to the International Space Station, as well as the introduction of Soyuz launches from the European spaceport at Kourou. These strengths, however, are offset by weaknesses in retention of human capital talent.

- South Africa is divided, from a budgetary standpoint, between space investments focused on societal usage of external assets already in space and investments focused on building the country's own space industrial base.

- South Korea's two failed launch attempts contributed to an organizational shakeup, but have not reduced its determination to become the newest country to achieve independent spaceflight.

- Ukraine has an enviable space industrial base, but limited domestic demand for its space hardware. It is aggressively seeking partners overseas, but has not yet engaged with key emerging markets.

Futron Releases 2012 Space Competitiveness Index - SpaceRef Business
 

santosh10

Senior Member
Joined
Oct 5, 2014
Messages
1,666
Likes
177
Most-Favoured FDI Destination: UN report


Firms see India 3rd most-favoured destination: UN report

NEW DELHI: Major global companies consider India their third most favoured destination after China and the United States, a U.N. report said on Thursday, and investment inflows could increase by more than 20 percent both this year and next.

Foreign direct investment (FDI) flows into India leapt 30 percent to nearly $32 billion in 2011, though held back by slow pace of reforms, it still remains a long way down the league table of FDI recipients.

China drew $124 billion last year, while Brazil attracted nearly $67 billion and Russia $53 billion..

"The FDI inflows into India can go up by 20-25 percent this year and by about 20 percent next year, if the present trend continues," said Nagesh Kumar, Chief Economist, United Nations Economic and Social Commission for Asia and the Pacific, while releasing the UNCTAD's World Investment Report 2012.

Some 179 global companies - from the manufacturing, services and primary sectors - were surveyed between February and May, on their favoured investment destinations for 2012 to 2014.

Kumar said FDI growth seems to be keeping its momentum in 2012, referring to furniture maker IKEA and Coca Cola's (KO.N) recent announcements to pump nearly $5 billion combined into India over the long term.

Though India's economic growth slowed to 5.3 percent in the March quarter, its slowest in nine years, its trends still compared favorably, Kumar said.

"Compared to many other places, India is doing better in terms of growth," he said, adding global investors were looking at the long term prospects and wide market in Asia's third largest economy.

The report said worldwide FDI flows exceeded the pre-financial crisis average in 2011, reaching around $1.5 trillion, despite turmoil in the global economy, and is projected around $1.6 trillion this year.

Global companies are sitting on hefty cash reserves and waiting for the euro zone situation to stabilise before investing, he said.

Earlier this year India allowed full foreign ownership of single brand retailers, although late last year it backtracked on a plan to allow in foreign supermarkets.

Many investors are hoping it revives that plan soon, after Prime Minister Manmohan Singh recently took over the finance portfolio and talked about the need to address problems in the insurance and mutual fund industries, as well as taxation.

Kumar said corporate investors look at long term prospects and recent controversies over retroactive tax proposals broadly aimed at taxing companies like Vodafone (VOD.L), or proposed general anti-tax avoidance rules ( GAAR) would not hurt India's prospects as an investment destination.

Firms see India 3rd most-favoured destination: UN report - Moneycontrol.com
 

santosh10

Senior Member
Joined
Oct 5, 2014
Messages
1,666
Likes
177
Global Innovation Index rankings


=> Innovation Efficiency Index, top 10


santosh10

Senior Member
Joined
Oct 5, 2014
Messages
1,666
Likes
177
Debt on India and Other Emerging Economies

While concerning India, as I have more knowledge about India, we find its Public Debt at around 50% to GDP and Total National Debt closed to 65%. but as total foreign reserve of India itself stood at around $320billion, very closed to it's total Foreign Debt at around $350billion to date. so I would say that Total National Debt on India would come at around 55%. (as, the Foreign Reserve holding by India does means for borrowing debt of other countries, which may be used for debt payments, makes sense?)

also, as discussed in the post as below, India's GDP would grow by at least 6.0%+ for the next 20 years time, so it has a little meaning, how much debt, an emerging economy like India really has. in fact, around 55% Debt to GDP does looks impressive, i think......

an estimate of Public Debt and Government Debt on the different countries is given as below......

=> List of countries by public debt - Wikipedia, the free encyclopedia


=>
and on comparison with the above GDP curves of falling economies as above, we have growth rate of emerging economies like India, Indonesia, Turkey, China etc as below. here we may clearly see that emerging economies like India, for example, having 6.5%+ average growth rate per year since 2008 recession....

India GDP Annual Growth Rate | 1951-2014 | Data | Chart | Calendar

Indonesia GDP Annual Growth Rate | 2000-2014 | Data | Chart | Calendar

Turkey GDP Annual Growth Rate | 1999-2014 | Data | Chart | Calendar

China GDP Annual Growth Rate | 1989-2014 | Data | Chart | Calendar


=> along with the Government/National Debt level as above, this is how Household Debt of emerging economies like BRIC stand as compare to these falling economies. :thumb:


=> Total Debt on BRIC/India

we have one more picture of Total Debt level of BRIC as compare to these falling economies as below. here about India, we generally say few points as below:

1st; Total Household Debt of India is much less than the total Gold Reserves in these houses of India.

2nd; Total Foreign Debt on India is closed to total Foreign Reserve of India.

3rd; Total 'Public Debt', excluding foreign debt is well maintained below 50% to GDP, along with at least 6%+ expected growth rate for the next 20 years+

a comparison of Total Debt on BRIC with the falling OECD economies is as below :ranger:


santosh10

Senior Member
Joined
Oct 5, 2014
Messages
1,666
Likes
177
GDP estimates show worst may be over
February 8, 2014


Agriculture and allied sectors show improvement

The Central Statistical Office (CSO) released on Friday estimates of 2013-14 Gross Domestic Product (GDP) growth, pegging it at 4.9 per cent. In 2012-13, the economy grew at 4.5 per cent, the lowest in a decade. :ranger:

Since the growth during the April-September 2013 was 4.6 per cent, a full-year CSO estimate of 4.9 per cent implies that the economy is expected to grow at just under 5.4 per cent during the second half of 2013-14. The estimate, therefore, shows the worst may be over and the economy will bounce back in the second half of the current fiscal something that the UPA government has been stating. Prime Minister Manmohan Singh said in his press conference last year that India's own growth momentum will revive.

The pick-up has come mainly from the Agriculture, forestry and fishery sectors that the CSO estimates will grow at 4.6 per cent, against 1.4 per cent last fiscal.

Also, the services sector, including finance, insurance, real estate and business services, is estimated to grow at 11.2 per cent, compared with 10.9 per cent in 2012-13. Electricity, gas and water production is estimated to grow at 6 per cent, up from 2.3 per cent last fiscal. :ranger:

The CSO estimates project a contraction during the current fiscal in the manufacturing sector. :facepalm:

Keywords: India's GDP, National Council of Applied Economic Research, Central Statistical office, gross domestic product

GDP growth will not be less than 5%, says Chidambaram - The Hindu
 

santosh10

Senior Member
Joined
Oct 5, 2014
Messages
1,666
Likes
177
we hope India might have got 5th position in this regard by end 2013, as we do know that Eurozone economies suffered fall of Industrial Production since 2009 recession, in fact :ranger:


=> also, we have data's to 2009 as below, listing the total manufacturing output by countries till 2009 :thumb:

Countries Compared by Industry > Manufacturing output. International Statistics at NationMaster.com


=> one more news we have as below in this regard. this way considering 15.2% share of manufacturing in India's GDP at around $2.0 trillion by the financial year 2012-13, we find it to be around 0.152 * 2,000 = $300 billions, which would put India on the 5th or 6th spot in the above picture by 2013, at least, as we do know that all the major European nations suffered fall in Industrial output since 2009 :thumb:

The share of manufacturing in India's gross domestic product has been coming down, declining to 15.2 percent in fiscal 2012-13and is expected to fall below 15 percent in the current financial year since the sector is facing slowdown and unutilised excess capacity, an ASSOCHAM study has cautioned.

The other problem for the manufacturing has been a big setback for exports which find market for the industrial products in the overseas markets.

As per analysis of the disaggregate date made available till December, 2012 from April, exports to European Union and Asian countries has suffered a major setback. While exports to EU, accounting for 16.3 percent in India's merchandise exports, declined by 11.2 percent, those to Asian countries, (excluding Japan) with a share of 28.1 percent, contracted by 8.4 percent during April-September 2012.

Infrastructure bottlenecks and regulatory hurdles for mega projects are also hindrances in taking leap forward in industrial activity.:tsk:

Manufacturing's share in GDP on decline

=> India's Industrial production growth rate (%)


India - Industrial production growth rate - Historical Data Graphs per Year
 

santosh10

Senior Member
Joined
Oct 5, 2014
Messages
1,666
Likes
177
we may have a look on the list as below too. to have an idea about the Stock Market Capitalization of the major economies, as below :ranger:

This entry gives the value of shares issued by publicly traded companies at a price determined in the national stock markets on the final day of the period indicated.

https://www.cia.gov/library//publications/the-world-factbook/rankorder/2200rank.html


=> in fact Indian Stock Market, BSE, was at its highest by mid 2008, at around $1.70trillion+ i remember,


=> and the same while considering "Total Market Capitalization to GDP ratio of BRIC", we have as below: (as of 2012)


If you have been working daily with macro numbers then probably this would entice you. Total market capitalization to GDP is an indicator of the total listed wealth of a country as a percentage of its GDP. Ratio above 100% which actually values economy more than its GDP is said to depict that the market is overvalued, while a value of around 50%, which is near the historical average for the U.S. market, is said to show undervaluation. More developed a country is more can be its market capitalization to GDP ratio. Since there isn't any specific level for straight conclusion, one should compare this ratio with peer (in economy terms) countries.

Total market capitalization to GDP ratio | Fixed Income India
 

santosh10

Senior Member
Joined
Oct 5, 2014
Messages
1,666
Likes
177
China Ranked Most Competitive Manufacturing Nation in the World

Over the next five years, 20th-century manufacturing stalwarts like the United States, Germany and Japan will be challenged to maintain their competitive edge to emerging nations such as China, India and Brazil, according to the 2013 Global Manufacturing Competitiveness Index report from Deloitte Touche Tohmatsu Limited's (DTTL) Global Manufacturing Industry group and the U.S. Council on Competitiveness. :thumb:

The report confirms that the landscape for competitive manufacturing is in the midst of a massive power shift – based on an in-depth analysis of survey responses from more than 550 chief executive officers (CEOs) and senior leaders at manufacturing companies around the world.

(India looks good as below???? :India:)


The 2013 Global Manufacturing Competitiveness Index once again ranks China as the most competitive manufacturing nation in the world both today, and five years from now. Germany and the United States round out the top three competitive manufacturing nations, but, according to the survey, both fall five years from now, with Germany ranking fourth and the United States ranking fifth, only slightly ahead of the Republic of Korea. The two other developed nations currently in the top 10 are also expected to be less competitive in five years: Canada slides from seventh to eighth place and Japan drops out of the top 10 entirely, falling to 12th place.

(we hope to see India on 2nd place soon, as below :thumb:


The report found that access to talented workers is the top indicator of a country's competitiveness – followed by a country's trade, financial and tax system, and then the cost of labor and materials. Enhancing and growing an effective talent base remains core to competitiveness among the traditional manufacturing leaders – and increasingly among emerging market challengers as well.

Manufacturing still matters a great deal for the economic prosperity of 20th century powerhouses – and these nations continue to have enough going for them to stay in the game and even thrive.

China Ranked Most Competitive Manufacturing Nation in the World - arabiangazette.com
 

santosh10

Senior Member
Joined
Oct 5, 2014
Messages
1,666
Likes
177
first here, the Table by World Bank as below clearly tells us the dominance of China on the side of High Tech Productions, the real Rise of China :china:

also its good to see India exporting more High Tech Products than Brazil, as below. it does says that India is somewhere, but yes, far behind China :ranger:

even if High Tech business of China has a share of imported component too, but we do know that it would only rise :ranger:

=> High-technology exports (current US$) | Data | Table
 

Latest Replies

Global Defence

New threads

Articles

Top