Eurozone Crisis online

santosh10

Senior Member
Joined
Oct 5, 2014
Messages
1,666
Likes
177
along with the last post, we now find super power US pumping record oil-gas at present, but it still doesn't show enough impact on employment-job creation to bring it back to the level of pre-crisis period of mid 2008. as discussed in the thread as below:

U.S. Oil Output to Overtake Saudi Arabia’s by 2020 | Indian Defence Forum


In a first, gas and other fuels are top U.S. export
Measured in dollars, the nation is on pace this year to ship more gasoline, diesel, and jet fuel than any other single export, according to U.S. Census data going back to 1990. It will also be the first year in more than 60 that America has been a net exporter of these fuels.

Just how big of a shift is this? A decade ago, fuel wasn't even among the top 25 exports. And for the last five years, America's top export was aircraft. :facepalm:


Gas, other fuels are top U.S. export – USATODAY.com
.
=> we now going to see competition of US with its friend on oil-gas export soon,...
:tsk:
.
=> in fact, we do see enough changes in most of the OECD economies since 2008-09 recession. we now find net migration of residents of Sydeny-Melbourne to Western Australia within Australia since then, which has around 45% share in total Australia's export. share of mining-minerals-gas-core products have 70%+ share in total Australia's export. its now a true sense compared to Gulf nations in this regard
Further complicating the picture for U.S. exports are uncertainties over future global demand for LNG. Australia and Qatar, among other countries, have expanded their own gas exports in recent years and are well-placed to supply potential customers in Asia and Europe. Due to the cost of liquefying and transporting gas, U.S. exports may not be cost-competitive if domestic prices rise in coming years. :coffee:

U.S. Approves Natural-Gas Export Plan With Freeport Project - WSJ
 

santosh10

Senior Member
Joined
Oct 5, 2014
Messages
1,666
Likes
177
Relation of Social Security with the Reduced Crime Rate in US-UK

further to the above statistics stating UK too as the worse side of Europe, we have pie chart of their budget expenditure as below.

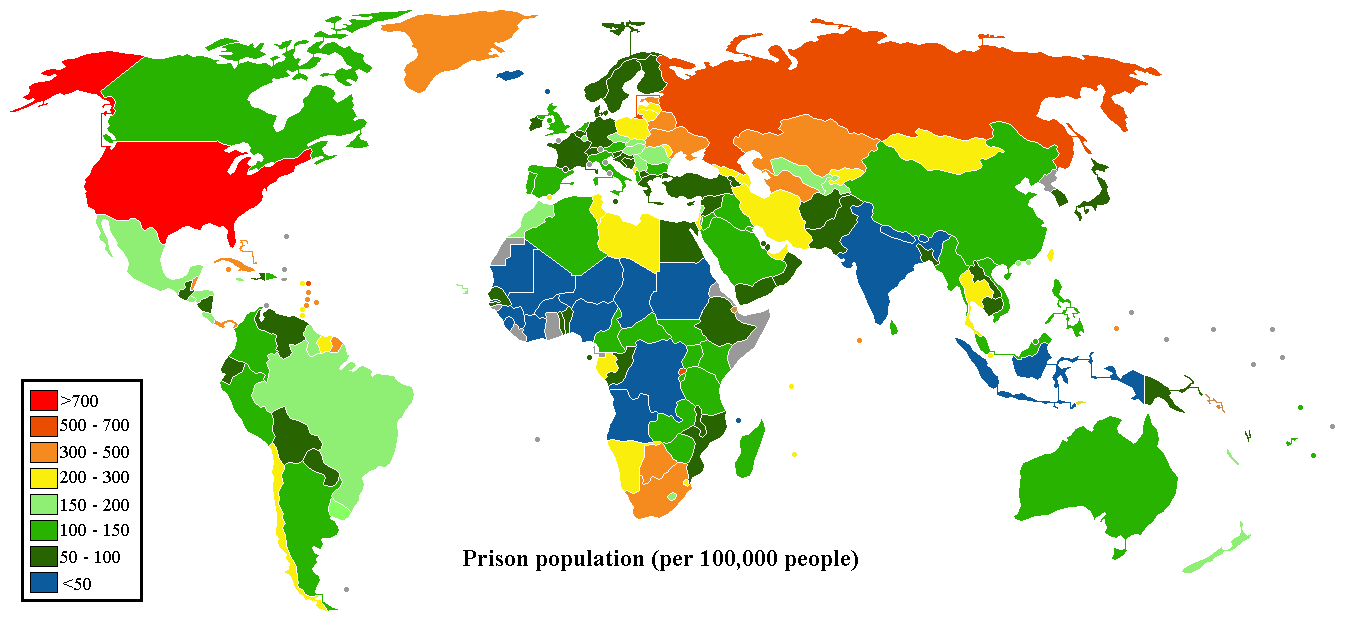
Crime Rate of developing countries mainly emerge from poverty, people in need do crimes, as per circumstances. while the US-UK have all the social security+free medical etc? why don't they even match with the crime rate of Asian nations?????

more than 50% budget of US goes for social security+medical, (24%+24%).
https://en.wikipedia.org/wiki/Expenditures_in_the_United_States_federal_budget
on the top of that, over $74.0billion+ is spent on handling prisoners there also...
In October 2013, the incarceration rate of the United States of America was the highest in the world, at 716 per 100,000 of the national population. While the United States represents about 4.4 percent of the world's population, it houses around 22 percent of the world's prisoners.[1] Corrections (which includes prisons, jails, probation, and parole) cost around $74 billion in 2007 according to the U.S. Bureau of Justice Statistics.[2][3]

https://en.wikipedia.org/wiki/United_States_incarceration_rate
=>

while 59% of UK's budget goes for social security+medical+education and then the number of interest payment on the debt also come, the very first government expanses.... :facepalm:
https://en.wikipedia.org/wiki/United_Kingdom_budget
.

=> The Asia
https://en.wikipedia.org/wiki/List_of_countries_by_incarceration_rate#Incarceration_rates

A Crime mainly Means for its Seriousness


and i repeat, "Incarceration Rate is the best way to measure Crime Rate as we do know that long term imprisonment is applicable to serious crimes only. means, if there were few fighting on the streets then you would be released within days if no serious injuries. but if someone died, or someone was raped, then obviously you would go for a very long."

its so simple that, there might be so many driving offenses which can result is penalty only in most of cases, while a crime does means for its seriousness, like robberies/ murders/ serious assaults/ rape/ drugs smuggling etc....... even having small amount of drugs for personal use isn't a punishable offense in Australia, but smuggling drugs does means for 10years+ imprisonment, and here we mainly look on the Incarceration Rate comparison.

as we do know that even if many types of small crimes go unpunished in a developing country, like driving offenses etc, the major crimes like murders/rapes/robberies can't go unnoticed as we do have proper identities of civilians/IDs of people in developing countries like India/Indonesia/ Philippines/Vietnam type countries, and here we again find "Incarceration Rate" comparison of our interests
 
Last edited:

santosh10

Senior Member
Joined
Oct 5, 2014
Messages
1,666
Likes
177
=>
Income-Debt-Buying Power comparison of Indians, British and Americans

(in exchange rates terms)

Per Capita income of US = $50,000 (around)
Per Capita Income of UK = $38,000 (around)
Per Capita Income of India = $2,000 (around)

25 times difference
.

=> Government Debt
Government Debt per Capita in US = $18.5trillion for 310 million population = $60,000

Government Debt per Capita in India = $1.2trillion for 1.25billion population = $1,000

Government Debt per Capita in UK = $2.2trillion for 64million population = $34,000


=> "Total Debt" Per Capita of US = $60.5trillion for 310million population = $190,00 per person (around)

"Total Debt" Per Capita of India = $2.8trillion for 1.25billion population = $2,500 per person (around)

Total Debt Per Capita on UK = $12.0trillion for 64 million population = $190,000 per person (around)

around 80 times higher


=> buying products in Market, would be around 8 to 10 times difference, as per my experience.

coffee in India at 30 cents and in Sydney its $3.2 (10 times difference)

something we usual buy, a mineral water for Rs15 (30cents) in Delhi, while it was around $2.4, the cheapest one, for a similar one liter mineral water in Sydney.....

the cheapest Chinese take away food at $12 plus $2.0 for water, as compare to i pay around Rs90 ($1.5) a time here in Delhi

renting flat in Sydney starts with around $350 per week, the cheapest, means around $1,500 per month, plus other charges. as compare to renting a flat in my city, Lucknow, at around Rs 20,000 a month ($300).

parking in city, as you first drive to a shopping complex and then buy food whose prices isn't much different than India, for example. and similarly, even if you watch a movie, you pay dollar as compare to rupees in India.

even mobile charge at around 30 paisa per minute in India, less than 0.5 cent, while its around 20 cents per minute in Australia....

even for transportation, its around Rs 20 rupees(30 cents) in Delhi metro, as compare to minimum $3.5 one way in Perth-Sydney metro.....

i would put "on ground" purchasing power difference at around 8 to 10 times between India and US. the prices which matters us, the prices of driving, renting, food, travelling, mobile etc.... :tup:

hence, $2,000 'exchange rate term' per capita income of India would stand at around $15,000, using the factor of '7.5', as per its prices in US, for the what we buy-use the money on the ground, which affect the buying power of people.
hence this way, we find per capita income of India at around $15,000, as compare to per capita income of around $50,000 and $38,000 in case of US and UK respectively....
.
=>
while for the developing counties like India have their 40%+ GDP remains "undocumented", simply because they dont show their half of the salary. so even if we consider the factor just at around 5.0, GDP Per Capita of India would still come at around $15,000 on PPP, as compare to around $38,000 in UK and $50,000 in US. while high growth rate of India does promise a brighter future, while the today's OECD economies are mostly saturated, having done hefty cuts in budget expenditure since 2009 recession too, hence limited investment has further undermined the growth prospects. which would hard for them to even match with their 1.5% average growth rate of last 25years since 1991 too...

https://en.wikipedia.org/wiki/List_of_countries_by_GDP_(PPP)#Lists
.
 
Last edited:

santosh10

Senior Member
Joined
Oct 5, 2014
Messages
1,666
Likes
177
.
further, as discussed in the above post, the term "Total Debt" or "Overall Debt" includes Government Debt+Household Debt+Business debt, mainly....

its a rough calculation for US-UK-India from the picture of 'The Economist' newspaper as below. an article about US's total debt, here we have.....
Total US debt soars to nearly $60 trn, foreshadows new recession

The problem is, the more debt we have, the more future income must be used to pay the debt and its interest, which reduces the money we have to spend on things. This works to slow the economy, Butler wrote.


http://www.rt.com/usa/166352-us-total-debt-sixty-trillion/
.

=> the 'factored' Total Debt on major OECD economies is as below:-
 
Last edited:

Latest Replies

Global Defence

New threads

Articles

Top