United States - Correlation between Gini and Minorities.

trackwhack

Senior Member
Joined
Jul 20, 2011
Messages
3,757
Likes
2,590
USA - Gini Co-eff by County


USA - Minority Percentage by County


Since these two are only illustrations and I do not have the data tables there arent any numbers that we can discuss unless someone else has some data. But a lot can be inferred from these images.
 

Daredevil

On Vacation!
Super Mod
Joined
Apr 5, 2009
Messages
11,615
Likes
5,772
I can infer one thing at the first go. Where Gini coefficient is low, the minority population is also low. Must be due to low incomes of the migratory population.
 

trackwhack

Senior Member
Joined
Jul 20, 2011
Messages
3,757
Likes
2,590
The second map shows how many counties in the US has minorities actually as majority. Deep blue is more than 60%. The last time that the US national Gini reached current levels was during the great depression in . But at that time the US demography was markedly different.

This is the official US Gini-coeff


It is available only until 2009, but has since closed in to .50.


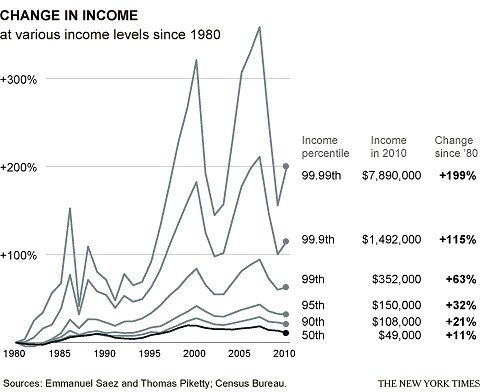
Here is the top decile income trend.


Wage inflation trend.


Wage inflation has only occurred if you belong to the top rung. If you factor in inflation, the lowest 50% of the US earns less than half of what they used to earn 50 years back.
 
Last edited:

Global Defence

New threads

Articles

Top