High Debt Risk in US

sunny_10

Tihar Jail
Banned
Joined
Dec 23, 2013
Messages
197
Likes
23


High Debt Risk in US

Abstract

America is on a dangerous budget path. Current spending and debt are dangerously high, and future spending and debt are on track to rise even higher in large part due to increasing entitlement spending. Academic research shows that advanced economies like the United States are at risk of significant and prolonged reductions in economic growth when public debt reaches levels of 90 percent of GDP. High public debt threatens to drive interest rates up, to crowd out private investment, and to raise price inflation. The implications would be severe and pronounced for all Americans, but most especially for the poor, the elderly, and the middle class. U.S. policymakers should learn from Greece and Japan and avoid a fiscal crisis and economic stagnation brought about by public debt overhang.

Growing federal debt also would increase the probability of a sudden fiscal crisis, during which investors would lose confidence in the government's ability to manage the budget and the government would thereby lose its ability to borrow at affordable rates. Such a crisis would"¦probably have a very significant negative impact on the country.
-Congressional Budget Office, 2012 Long-Term Budget Outlook​

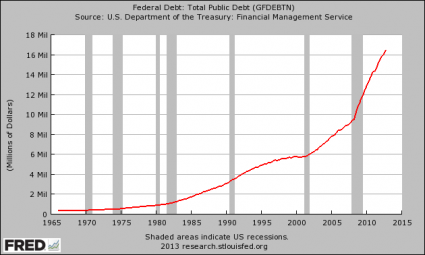
U.S. federal spending in 2013, combined with depressed receipts from a weak economy, is on track to result in a deficit of $850 billion. Publicly held debt in the United States will exceed 76 percent of gross domestic product (GDP) in 2013, and chronic deficits are projected to push U.S. debt to 87 percent of the economy in 10 years.[1] Debt is projected to grow even more rapidly after 2023. Recent economic research, especially the work of Carmen Reinhart, Vincent Reinhart, and Kenneth Rogoff, confirms that federal debt at such high levels puts the United States at risk for a number of harmful economic consequences, including slower economic growth, a weakened ability to respond to unexpected challenges, and quite possibly a debt-driven financial crisis.[2]


The federal government is quickly exhausting its ability to manage its bills, with debt having already reached the statutory debt ceiling.:toilet: The resulting debate should focus on the need to reduce federal spending immediately and over the long term by making necessary and prudent reforms to the nation's major entitlement programs, and thus reduce the continued buildup of debt and the expected harmful consequences increasingly confirmed by academic research.


Vulnerable Budget Path
In the contentious 2011 debate over the U.S. debt limit, President Barack Obama and Congress agreed to raise the debt ceiling by $2.1 trillion in exchange for specified spending reductions over 10 years. The Budget Control Act allowed the President to raise the limit in three increments from $14.29 trillion to $16.39 trillion.[3] At the time, the United States lost its seemingly permanent AAA rating from Standard & Poor's, starkly affirming the risk arising from the nation's budget path.[4]:toilet: America's budget problems are twofold: (1) spending and debt are dangerously high today, and (2) future spending and debt are on track to rise even higher.

=> The US Debt Piles Up

=> U.S. National Debt Clock

=> U.S. National Debt Clock : Real Time

As dangerous as these trends are, the long-term unfunded obligations in the nation's major entitlement programs loom like an even darker cloud over the U.S. economy. Demographic and economic factors are expected to combine to drive spending in Medicare and Social Security to unsustainable heights. The major entitlements and interest on the debt are on track to devour all tax revenues by in less than one generation.[5]


While tax revenues are expected to return to their historically average levels of 18.5 percent, total federal spending driven in large part by entitlements is projected to hover well above the historical level of about 20 percent in the near term.[6] In a mere 25 years, federal spending under current policy is projected to consume as much as 36 percent of GDP.[7]

America's entitlement programs, by definition, span generations. It is vital in assessing their sustainability to consider their long-term implications. Over the 75-year long-term horizon, the combined unfunded obligations arising from promised benefits in Medicare and Social Security alone exceed $48 trillion.[8] The federal unfunded obligations arising from Medicaid and even from veterans' benefits are unknown, but would likely add many trillions more to this figure.

The International Monetary Fund,[9] the intergovernmental organization of 188 member states that seeks to ensure the stability of the international monetary system, warned that the U.S. lacks a "credible strategy" to stabilize its mounting public debt.[10] Such a strategy must begin with putting entitlement spending on a more sustainable long-term path. The sooner policymakers act, the less severe and the more gradual the necessary policy changes can be. Policymakers should not delay, since the economic consequences, particularly the impact on individuals in or planning retirement, would be pronounced and severe.

Research Confirms Danger of High Government Debt
Recent research confirms the dangers posed by high levels of government debt. Reinhart, Reinhart, and Rogoff examined over 110 years of economic data to conclude that advanced economies whose debt levels reach 90 percent of GDP face much slower economic growth.[11]

In 2009, Carmen Reinhart and Rogoff wrote This Time Is Different, a book The Economist called "a magisterial work on the causes and consequences of crises stretching back 800 years."[12] Their conclusions were based on a vast new accumulation of cross-country data, covering 66 countries across all regions of the world and spanning eight centuries. This dataset made it possible to study country debt episodes and crises much more comprehensively. Reinhart, Reinhart, and Rogoff's recent work on the impact of high public debt on growth and interest rates is based on this groundbreaking dataset.


The economists follow a descriptive approach, comparing economic variables for different countries as averages for debt-to-GDP ratios below and above 90 percent of GDP. Measures of comparison include averages for real GDP growth, real (inflation-adjusted) short-term interest rates, and real long-term interest rates. Public debt overhang episodes are analyzed for the causes of the debt, whether from specific wars, financial crises and economic depression, domestic turmoil, or other factors. The researchers refer to sustained periods of gross country debt persisting above 90 percent of GDP for five years or more as "public debt overhang episodes." Identifying 26 such episodes, of which 20 lasted for more than a decade, the research shows that even if such episodes begin with short-lived dramatic events, such as war or a financial crisis, the negative impact from high debt on growth lasts far beyond such events.

The authors' results should serve as a sobering wake-up call for policymakers. Reinhart, Reinhart, and Rogoff discovered that the average growth rate in countries experiencing public debt overhang is 1.2 percentage points lower than in periods with debt below 90 percent of GDP.[13] These public debt overhang episodes last an average of about 23 years. Thus, the cumulative effect of lower growth by one percentage point or more means that national income at the end of the period would be lower by roughly one-fourth. The growth rate of countries with exceptionally high levels of debt—more than 120 percent of the economy—drops even lower, by an average of 2.3 percentage points, which is roughly two-thirds.

These figures indicate just how dire the U.S. situation could become: According to the Congressional Budget Office baseline economic forecast, U.S. GDP is projected to be $25.9 trillion in fiscal year 2023. U.S. publicly held debt is projected to reach nearly 90 percent of GDP that year. Assuming a 2.2 percent growth rate over 23 years, U.S. GDP would reach $42.7 trillion in 2046 if there was no impact from the debt overhang. Applying the crude assumption that GDP would be reduced by 1.2 percentage points, in each year of the assumed 23-year debt overhang period, U.S. GDP growth would be slashed by more than half to a mere 1 percent. This would reduce U.S. GDP by more than $10 trillion, to only $32.6 trillion in 2046. The cumulative effect from the debt overhang would result in a level of GDP lower by nearly one-quarter at the end of the period.

The researchers also note that in addition to vast amounts of public debt, other measures of country debt, such as levels of state and local government debt, private debt, external debt (government and private debt owed to foreigners), and the unfunded obligations from retirement and medical care programs, have risen to unprecedented heights in advanced economies, including the United States.

In the U.S., the total amount of debt held by all 50 state governments combined amounted to $4.17 trillion in 2012. If one adds state debt to the U.S. gross national debt of $16.4 trillion, the combined state and federal debt exceeds $20.5 trillion. Moreover, the long-term unfunded obligations for Social Security and Medicare totaled $48 trillion in 2012—three times the current U.S. gross national debt. Even this measure does not include other federal obligations in the form of Medicaid or veterans' benefits, for example. While data across countries of these debt measures is difficult to obtain, other government debt certainly adds to the risks faced by countries with high public debt levels. :facepalm:

A Significant and Prolonged Drag on Economic Growth

Debt overhang reduces economic growth significantly and for a prolonged period of time in three main ways.

1. Higher Interest Rates. Creditors may lose confidence in the country's ability to service its debt and demand higher interest rates to offset the additional risk. Or, interest rates may rise simply because the government is attempting to sell more debt than private bondholders are willing to buy at current prices. Either way, higher interest rates raise the cost of the debt, and the government must then either tax its citizens more, which would reduce economic activity; reduce government spending in other areas; or take on even more debt, which could cause a debt spiral.

Higher interest rates on government bonds also lead to higher rates for other domestic investments, including mortgages, credit cards, consumer loans, and business loans. Higher interest rates on mortgages, car loans, and other loans would make it more costly for families to borrow money. Families may then have to delay purchasing their first home and other means of building financial security. For many Americans, the dream of starting a business would no longer be in reach. Higher interest rates have a real and pronounced impact on the lives of ordinary citizens and translate into less investment and thus slow growth in the rest of the economy. A weaker economy in turn would provide fewer career opportunities and lower wages and salaries for workers.

However, higher interest rates do not always materialize in countries suffering a debt overhang. According to Reinhart, Reinhart, and Rogoff, in 11 of the 26 cases where public debt was above 90 percent of GDP, real interest rates were either lower, or about the same, as during years of lower debt ratios. Soaring debt matters for economic growth even when market actors are willing to absorb it at low interest.[14]

Interpreted another way, in more than half of debt overhang cases, interest rates rose. In the case of the U.S., the Federal Reserve's policy of repeated quantitative easing has contributed to interest rates dropping to historical lows. Interest rates will likely rise at some point over the next several years. The Congressional Budget Office predicts that interest costs on the debt will more than double before the end of the decade, rising from 1.4 percent of GDP in 2013 to 2.9 percent as early as 2020.[15] High levels of U.S. public debt could push interest rates even higher with severe impacts for the American economy.

2. Higher Inflation. The United States has, as do other countries with independent currencies, an additional option to monetize its debts: replacing a substantial portion of outstanding debt with another form of federal liability—currency. The government could, through the Federal Reserve, inflate the money supply. The resulting increase in the rate of price inflation would devalue the principal of the remaining public debt. The resulting inflation would also destabilize the private economy, increase uncertainty, increase real interest rates, and slow economic growth markedly.

Inflation is particularly harmful for those Americans on fixed incomes, such as the elderly who rely on Social Security checks, pensions, and their own savings in retirement. By raising the cost of essential goods and services, like food and medical care, inflation can push seniors into poverty. Inflation and longer life expectancies can mean that some seniors run out of their savings sooner than anticipated, then becoming completely dependent on Social Security. Inflation inflicts the most pain on the poor and middle class by reducing the purchasing power of the cash savings of American families. Inflation also means that everyone has to pay more for goods and services, including essentials like food and clothing.

Moreover, severe inflation could dethrone the U.S. dollar as the world's primary reserve currency. Thus far, a major saving grace for the U.S. government has been that, in comparison with other advanced nations with major currencies, such as Europe and China, the U.S. dollar has retained its status as the best currency option for finance and commerce.[16] If Washington policies continue on their current path of ever-higher sovereign debt and a risky Federal Reserve policy, both of which lack a credible crisis coping strategy, confidence in the U.S. economy and monetary policy regime could erode. Such a development would be unprecedented in size and magnitude and the impact on Americans and the economy would be massive and severe.

For all these reasons, the Federal Reserve and central banks of all industrialized countries have adopted a policy favoring low and stable inflation, though the means by which they pursue this policy can vary substantially and their success is often spotty. Reversing this policy in favor of a policy of debt monetization and high inflation would be a radical departure in policy and practice. It would be the economic equivalent of a scorched earth policy, and its adoption is thus extremely unlikely.

How High U.S. Debt Levels Would Hurt Americans
High U.S. Debt Levels Risk"¦

Higher Interest Rates

  • Higher interest rates on mortgages, car loans, and other loans would make it more costly for families to borrow
  • money.
  • Families may have to delay purchasing their first home and other means of building financial security.
  • For many Americans, the dream of starting a business would no longer be in reach.

Higher Inflation

  • Inflation reduces the purchasing power of the cash savings of American families, inflicting the most pain on the
  • poor and middle class by eroding the value of their rainy day fund.
  • Inflation raises the prices on essential goods and services, like food, clothing, and medical care, and is particularly
  • harmful for the poor and those on fixed incomes, like the elderly.
  • Higher inflation and longer life expectancies together can mean that some seniors run out of their savings sooner
  • than anticipated, leaving them completely dependent on Social Security. Some may even end up in poverty.

Crowding Out Private Investment

  • Government deficit spending and its associated debt subtracts from the amount of private saving available for private
  • investment, leading to slower economic growth.
  • Less economic growth means fewer jobs, lower wages and salaries, and fewer opportunities for career
  • advancement.
  • Less private investment means fewer opportunities for innovation and the creation of productivity enhancing technologies,
  • putting the U.S. at a disadvantage with competing trading nations.

Solution

U.S. debt is quickly approaching economically damaging debt levels. U.S. lawmakers should delay no more. Congress and the President should take firm and immediate steps to balance the budget within 10 years, by cutting spending and reforming the entitlements.


3. Crowding Out Private Investment. Economic growth, especially increasing per capita income, depends on the proper functioning of prices to signal and markets to respond, but it also depends fundamentally on increasing the amount and quality of productive capital available to the workforce. The amount of capital employed in the economy needs to increase at least to keep pace with the growth in the labor force to maintain current living standards, and must grow even faster—to increase the amount of capital per worker—to raise worker productivity and thus wages and salaries.

Government deficit spending and its associated debt subtracts from the amount of private saving available for private investment, leading to slower economic growth. Unlike what staunch believers of government spending for economic stimulus claim, government stimulus spending does the opposite of growing the economy. Less economic growth caused by high government spending and debt results in fewer available jobs, lower wages and salaries, and fewer opportunities for career advancement.

Prolonged debt overhang in the United States, even at low interest rates, would be a massive drag on economic growth, leading to significantly reduced prosperity for Americans. In the words of Reinhart, Reinhart, and Rogoff: "This debt-without-drama scenario is reminiscent for us of T. S. Eliot's (1925) lines in The Hollow Men: 'This is the way the world ends / Not with a bang but a whimper.'"[17]

Europe's Fiscal Crisis: Precursor for the United States?
Europe is experiencing an extended fiscal and economic crisis with no end in sight. In addition to adopting a common currency regime lacking most of the institutional trappings necessary for its survival, many countries in Europe have lived beyond their means for many years. Many racked up massive government debts while benefiting from artificially low interest rates, as the euro signaled to markets that all European debts were alike. The poster child for this behavior, of course, is Greece. Greece racked up a debt-to-GDP ratio of 145 percent in 2010 and 165 percent in 2011.[18] Not surprisingly, investors eventually lost confidence in Greece's ability to service its debts. European lawmakers responded in early 2011 with a combination of a bailout and fiscal austerity. Nevertheless, Greece defaulted on its debts to the detriment of investors and other European taxpayers.

Many other European countries also amassed public debts beyond 90 percent of their economies—for instance Italy (100 percent) and Portugal (97 percent) in 2011—and are now undergoing wrenching austerity and prolonged recessions. In addition to disastrous currency policy, these countries also have a fiscal policy culprit in common: high levels of government spending on entitlements—a fiscal situation by no means foreign to the U.S. government.

Avoiding Japan's "Lost Decades" for America
Not all countries that build debt mountains suffer from a lack in investor confidence and go into default. Japan is arguably the world's most indebted major economy, with net public debt at 126 percent of GDP, and yet creditors continue to lend to the Japanese government. Japan amassed this public debt to a large extent in the midst of its "lost decades"—1991 to 2010—while falling again and again for the wishful thinking that government deficits stimulate economic growth. History and economic fundamentals have shown this thinking to be wrong. This misguided policy is standing in the way of a Japanese recovery. As The Heritage Foundation's Derek Scissors and J. D. Foster explain:

Japan's debt is almost entirely domestically financed, which means gigantic sums are shifted from the private sector to the public sector, where the social return on investment is almost nil and the yields paid on the debt are only slightly better. The huge debt and oversized government has sapped Japan's domestic sources of growth.[19]​

Japan is experiencing a prolonged debt overhang episode with, as yet, no debt crisis drama because Japanese citizens are prodigious savers. The Japanese mostly owe their debt to themselves as Japanese citizens have been willing to forgo consumption and have been buying government bonds for a long time, enabling the Japanese government to accumulate gross debt levels more than twice the size of the Japanese economy. Instead, the country suffers from persistently weak economic growth.

The IMF warned the United States and Japan against a further buildup of risk by failing to lower their debt levels. U.S. policymakers should not allow themselves to be lulled into complacency by low interest rates. Policymakers must act now to allow an orderly and controlled mechanism to reduce public debt—not wait for a sovereign debt crisis to force their hands.[20]

A full-fledged fiscal crisis hits a country with the same force as a patient suffering severe trauma. However, a no-drama debt overhang that reduces growth slowly drains the life from the patient, like a long-term disease. The U.S. should not delay adopting a credible strategy to resolve chronic deficits and debt, lest it find itself on the stretcher.

A Credible Strategy
Federal budget deficits and debt are massive today—and future spending and debt projections are far worse if Congress and the President fail to act. Federal spending was about 23 percent of GDP in 2012—far above the historical average of 20.2 percent. It is projected to surge to nearly 36 percent in less than one generation.:tsk: This spending is the cause of the chronic deficits that are driving the debt higher yet. Public debt is projected to reach 87 percent of GDP by 2023 and rise sharply in later years.

Two programs in particular—Social Security and Medicare—are taking over a quickly expanding share of federal spending. In addition, they suffer from programmatic weaknesses. Social Security and Medicare provide an important safety net for seniors, but in their current form the programs are unsustainable over the medium term and long term. These programs take up 39 percent of the budget today and are projected to grow to 44 percent of federal spending in just 10 years. At $48 trillion in net-present value, their unfunded obligations are triple the size of the entire gross U.S. national debt.

There are numerous reforms to help shore up financing for these programs that garner bipartisan support and that can be implemented quickly. These include raising the Social Security eligibility age to match increases in longevity and correcting the cost-of-living adjustment (COLA) to more accurately measure the impact of inflation on beneficiaries. In Medicare, raising the eligibility age to match Social Security makes common sense. Seniors with high incomes already pay a higher share of their own Medicare costs, and the remaining subsidy should be pared back even further.

Beyond resolving immediate financing challenges, there are bolder reforms to resolve many of the programs' inherent weaknesses. The goal should be to arrive at a strengthened social safety net for those seniors who need it. Doing so in an affordable manner means turning Social Security and Medicare into true insurance against poverty in retirement.

For Social Security, benefits should be phased out for upper-income retirees. Consolidating Medicare's three distinct components—Parts A, B, and D—and collecting a combined higher premium would save money and simplify the program. Lawmakers should begin pursuing a credible strategy on reining in massive budget deficits and debt by implementing proposals such as outlined here.[21]

The Time to Act Is Now
By neglecting the regular budget order—the institutional schedule to assess government spending and allocate taxpayer dollars with prudence—Congress and the President are increasingly failing to govern. Congress has only budgeted when forced to do so. Reaching the debt ceiling should be such an occasion, and Congress should not delay the decision again on necessary reforms and spending reductions. The President's and Congress's failure to establish a credible strategy for reining in massive deficits and debts in 2011 led Standard & Poor's to downgrade the U.S. credit rating,[22] Moody's, another major rating agency, warned Congress early in 2013 that failure to provide a basis for meaningful improvement in the government's debt ratios over the medium term could "affect the rating negatively."[23] Ratings agencies provide important signals to investors about the risks associated with investing in government bonds. Further downgrades of the U.S. debt and demand by capital markets will eventually lead to higher interest rates, whose costs would drive up federal spending and debt even more. As U.S. debt is quickly approaching economically damaging debt levels, U.S. lawmakers should delay no more. The time to act is now.

—Romina Boccia is Research Coordinator in the Thomas A. Roe Institute for Economic Policy Studies at The Heritage Foundation.

How the United States' High Debt Will Weaken the Economy and Hurt Americans
 
Last edited:

sunny_10

Tihar Jail
Banned
Joined
Dec 23, 2013
Messages
197
Likes
23
.
=> US National Debt by Year 2008_2018 - Charts Tables History

=> U.S. National Debt Clock : Real Time


US Debt Piles Up
August 30th, 2012

What a spectacle the world has become...full of farce and morbid hilarity.
The US government just breached the $16 trillion debt threshold. The folks at Zero Hedge tell us it took the government just 286 days to add an additional $1 trillion to the US debt pile. That's $3.5 billion a day. Extrapolating, they tell us US debt will hit:

"¢$17 trillion on June 10, 2013;
"¢$18 trillion on March 23, 2014;
"¢$19 trillion on January 3, 2015; and
"¢$20 trillion on October 16, 2015

The US Debt Piles Up
 

sunny_10

Tihar Jail
Banned
Joined
Dec 23, 2013
Messages
197
Likes
23
.
We have National Debt Data's about the major OECD countries as below :ranger:

The 20 countries with the highest National Debt, in relation to GDP

Japan 237.92%

Greece 158.55%

Italy 126.98%

Portugal 122.99%

Ireland 117.12%

United States 106.53%

Belgium 99.6%

United Kingdom 90.31%

France 90.29%


Spain 90.69%

Source: IMF, Worldwide; International Monetary Fund

"¢ Countries with the highest public debt 2012 | Statistic
 

sunny_10

Tihar Jail
Banned
Joined
Dec 23, 2013
Messages
197
Likes
23
and where exactly the damage is being made? the reason why there is limited economic hope in US, as there is just no real expenditure on investments to accelerate growth. then we may have an idea about Budget Expenditure of US as below too

we have Budget Expenditure of US for 2012 as below, which had share of Social Security of 22%, Medical Expanses 23%, Defense 19%, Net Interest 7% = 22+23+19+7 =71% of total US's budget, then the number of Government's expenditure also comes . and this 71% of Budget Expenditure is only for interest payments, defence, Welfare....... means all waste at Budget Deficit of 8% to US's GDP itself.
(here we considered Interests at 7% as we do know it would be higher this year, due to higher borrowing to cover deficit :toilet:)


sunny_10

Tihar Jail
Banned
Joined
Dec 23, 2013
Messages
197
Likes
23
.
But do have a good news for the US's economy as below, why its still better than other OECD economies like UK, Italy, Spain, France etc? here, the only benefit we will have, its on the side of US's competition with their friends like Saudi Arabia on the side of oil/gas export from 2020+, hence reducing energy prices this way, as below :ranger:

In a first, gas and other fuels are top U.S. export

NEW YORK (AP) – For the first time, the top export of the United States, the world's biggest gas guzzler, is — wait for it — fuel.

Measured in dollars, the nation is on pace this year to ship more gasoline, diesel, and jet fuel than any other single export, according to U.S. Census data going back to 1990. It will also be the first year in more than 60 that America has been a net exporter of these fuels. :ranger:

Just how big of a shift is this? A decade ago, fuel wasn't even among the top 25 exports. And for the last five years, America's top export was aircraft. :ranger:

Gas, other fuels are top U.S. export – USATODAY.com
 

sunny_10

Tihar Jail
Banned
Joined
Dec 23, 2013
Messages
197
Likes
23
.
and this is the true state of unemployment Rate of US, in terms of The labor force participation rate, as below. its on the lowest in many years right now, at around 63.0% by last month, means less than 2/3rd employed. and this excludes House Wives, students and early retired people too, as below.... :ranger:


Labor Force Statistics from the Current Population Survey


Bureau of Labor Statistics Data


Typically "working-age persons" is defined as people between the ages of 16-64. People in those age groups who are not counted as participating in the labor force are typically students, homemakers, and persons under the age of 64 who are retired. :ranger:

What is the Labor Force Participation Rate?
 

sunny_10

Tihar Jail
Banned
Joined
Dec 23, 2013
Messages
197
Likes
23
.
in fact, the Employment Crisis talks of US would really be ended by the news as below, stating dramatic fall in Mexican born people in US during last 3-4 years, who are now going back to Mexico for better/more paid jobs. it shows around 0.9 million drop in Mexican born people during just last 3-4 years, from 12.8million in 2009 to 11.9million by 2011 as below :facepalm:


sunny_10

Tihar Jail
Banned
Joined
Dec 23, 2013
Messages
197
Likes
23
40 'Frightening' Facts On The Fall Of The US Economy
05/27/2013

If you know someone that actually believes that the U.S. economy is in good shape, just show them the statistics in this article. When you step back and look at the long-term trends, it is undeniable what is happening to us. We are in the midst of a horrifying economic decline that is the result of decades of very bad decisions. 30 years ago, the U.S. national debt was about one trillion dollars. Today, it is almost 17 trillion dollars. 40 years ago, the total amount of debt in the United States was about 2 trillion dollars. Today, it is more than 56 trillion dollars. At the same time that we have been running up all of this debt, our economic infrastructure and our ability to produce wealth has been absolutely gutted. Since 2001, the United States has lost more than 56,000 manufacturing facilities and millions of good jobs have been shipped overseas. Our share of global GDP declined from 31.8 percent in 2001 to 21.6 percent in 2011. The percentage of Americans that are self-employed is at a record low, and the percentage of Americans that are dependent on the government is at a record high. The U.S. economy is a complete and total mess, and it is time that we faced the truth. :ranger:

The following are 40 statistics about the fall of the U.S. economy that are almost too crazy to believe...

#1, Back in 1980, the U.S. national debt was less than one trillion dollars. Today, it is rapidly approaching 17 trillion dollars...


#2, During Obama's first term, the federal government accumulated more debt than it did under the first 42 U.S presidents combined.

#3, The U.S. national debt is now more than 23 times larger than it was when Jimmy Carter became president.

#4, If you started paying off just the new debt that the U.S. has accumulated during the Obama administration at the rate of one dollar per second, it would take more than 184,000 years to pay it off.

#5, The federal government is stealing more than 100 million dollars from our children and our grandchildren every single hour of every single day.

#6, Back in 1970, the total amount of debt in the United States (government debt + business debt + consumer debt, etc.) was less than 2 trillion dollars. Today it is over 56 trillion dollars...:facepalm:


#7, According to the World Bank, U.S. GDP accounted for 31.8 percent of all global economic activity in 2001. That number dropped to 21.6 percent in 2011.

#8, The United States has fallen in the global economic competitiveness rankings compiled by the World Economic Forum for four years in a row.

#9, According to The Economist, the United States was the best place in the world to be born into back in 1988. Today, the United States is only tied for 16th place.

#10, Incredibly, more than 56,000 manufacturing facilities in the United States have been permanently shut down since 2001.

#11, There are less Americans working in manufacturing today than there was in 1950 even though the population of the country has more than doubled since then.

#12, According to the New York Times, there are now approximately 70,000 abandoned buildings in Detroit.

#13, When NAFTA was pushed through Congress in 1993, the United States had a trade surplus with Mexico of 1.6 billion dollars. By 2010, we had a trade deficit with Mexico of 61.6 billion dollars.

#14, Back in 1985, our trade deficit with China was approximately 6 million dollars (million with a little "m") for the entire year. In 2012, our trade deficit with China was 315 billion dollars. That was the largest trade deficit that one nation has had with another nation in the history of the world.

#15, Overall, the United States has run a trade deficit of more than 8 trillion dollars with the rest of the world since 1975.

#16, According to the Economic Policy Institute, the United States is losing half a million jobs to China every single year.

#17, Back in 1950, more than 80 percent of all men in the United States had jobs. Today, less than 65 percent of all men in the United States have jobs.

#18, At this point, an astounding 53 percent of all American workers make less than $30,000 a year.
(which excludes those 37% working age people who don't even have any job, which itself excludes house wives, students, early retired age people etc. and prices in USA its also in dollar so $30,000 and less does means for a non-luxury life :ranger:)

#19, Small business is rapidly dying in America. At this point, only about 7 percent of all non-farm workers in the United States are self-employed. That is an all-time record low.

#20, Back in 1983, the bottom 95 percent of all income earners in the United States had 62 cents of debt for every dollar that they earned. By 2007, that figure had soared to $1.48.

#21, In the United States today, the wealthiest one percent of all Americans have a greater net worth than the bottom 90 percent combined. :toilet: :tsk:

#22, According to Forbes, the 400 wealthiest Americans have more wealth than the bottom 150 million Americans combined.

#23, The six heirs of Wal-Mart founder Sam Walton have as much wealth as the bottom one-third of all Americans combined.

#24, According to the U.S. Census Bureau, more than 146 million Americans are either "poor" or "low income".

#25, According to the U.S. Census Bureau, 49 percent of all Americans live in a home that receives direct monetary benefits from the federal government. Back in 1983, less than a third of all Americans lived in a home that received direct monetary benefits from the federal government.

#26, Overall, the federal government runs nearly 80 different "means-tested welfare programs", and at this point more than 100 million Americans are enrolled in at least one of them.

#27, Back in 1965, only one out of every 50 Americans was on Medicaid. Today, one out of every 6 Americans is on Medicaid, and things are about to get a whole lot worse. It is being projected that Obamacare will add 16 million more Americans to the Medicaid rolls.

#28, As I wrote recently, it is being projected that the number of Americans on Medicare will grow from 50.7 million in 2012 to 73.2 million in 2025.

#29, At this point, Medicare is facing unfunded liabilities of more than 38 trillion dollars over the next 75 years. That comes to approximately $328,404 for every single household in the United States.

#30, Right now, there are approximately 56 million Americans collecting Social Security benefits. By 2035, that number is projected to soar to an astounding 91 million.

#31, Overall, the Social Security system is facing a 134 trillion dollar shortfall over the next 75 years.

#32, Today, the number of Americans on Social Security Disability now exceeds the entire population of Greece, and the number of Americans on food stamps now exceeds the entire population of Spain.

#33, According to a report recently issued by the Pew Research Center, on average Americans over the age of 65 have 47 times as much wealth as Americans under the age of 35.

#34, U.S. families that have a head of household that is under the age of 30 have a poverty rate of 37 percent.

#35, As I mentioned recently, the homeownership rate in America is now at its lowest level in nearly 18 years.

#36, There are now 20.2 million Americans that spend more than half of their incomes on housing. That represents a 46 percent increase from 2001.

#37, 45 percent of all children are living in poverty in Miami, more than 50 percent of all children are living in poverty in Cleveland, and about 60 percent of all children are living in poverty in Detroit.

#38, Today, more than a million public school students in the United States are homeless. This is the first time that has ever happened in our history.

#39, When Barack Obama first entered the White House, about 32 million Americans were on food stamps. Now, more than 47 million Americans are on food stamps.

#40, According to one calculation, the number of Americans on food stamps now exceeds the combined populations of "Alaska, Arkansas, Connecticut, Delaware, District of Columbia, Hawaii, Idaho, Iowa, Kansas, Maine, Mississippi, Montana, Nebraska, Nevada, New Hampshire, New Mexico, North Dakota, Oklahoma, Oregon, Rhode Island, South Dakota, Utah, Vermont, West Virginia, and Wyoming."

40 'Frightening' Facts On The Fall Of The US Economy | Zero Hedge
 
Last edited:

sunny_10

Tihar Jail
Banned
Joined
Dec 23, 2013
Messages
197
Likes
23
Trends in U.S. Military Spending

Military budgets are only one gauge of military power. A given financial commitment may be adequate or inadequate depending on the number and capability of a nation's adversaries, how well a country invests its funds, and what it seeks to accomplish, among other factors. Nevertheless, trends in military spending do reveal something about a country's capacity for coercion. Policymakers are currently debating the appropriate level of U.S. military spending given increasingly constrained budgets and the winding down of wars in Iraq and Afghanistan. The following charts present historical trends in U.S. military spending and analyze the forces that may drive it lower.

These charts draw on data from the Stockholm International Peace Research Institute (SIPRI) and from the U.S. Bureau of Economic Analysis (BEA). Both data sets include spending on overseas contingency operations as well as defense. This distinguishes them from data used in the U.S. budget, which separates defense spending from spending on overseas operations. :ranger:


In inflation-adjusted dollars, SIPRI's measure of U.S. military spending rose sharply after the terrorist attacks of 2001.

In calendar year 2012, military spending declined from $711 billion to $668 billion.

In dollar terms, this was the largest decline since 1991.

The reduction in U.S. operations in the Middle East and the sequester mean this figure is likely to fall again in 2013.


When U.S. inflation-adjusted military spending fell by one-third in the 1990s, the U.S. share of global military spending only fell by six percentage points because other countries, particularly Russia, reduced their military spending as well.

The 6 percent fall in U.S. military spending in 2012 resulted in a two percentage point fall in the global share, as military spending by the rest of the world remained essentially flat.

To see why U.S. military spending is likely to keep falling as a share of global military spending, even if the sequester does not go into effect, it helps to look at the drivers of this ratio. For any country, a change in military spending as a share of the global total can be attributed to two factors: changes in income and changes in the allocation of that income. A rising share of global military expenditure based on a rising share of global GDP (gross domestic product) is likely to be more sustainable over the long term than a rise based on a decision to spend more of GDP on defense at the expense of other priorities. The following charts distinguish between the impact of growth and the allocation of income on the U.S. share of global military spending.

From 1990 to 2000, U.S. growth roughly kept pace with global growth. So the impact of U.S. growth on the nation's share of global military spending (represented by the red bars) offset the impact of rest-of-the-world growth (represented by the purple bars). As a result, the net growth effect, shown by the blue line, was close to zero.

Over the past ten years, faster foreign growth has reduced the U.S. share of global military spending


The black line shows the U.S. share of world military spending at five-year intervals, while the bars show what drove the change during each five-year period. The blue bars show how willing the nation has been since 2000 to spend a rising share of GDP on defense. Even if one assumes this commitment holds steady in the next five years, and if one uses International Monetary Fund (IMF) growth estimates, the U.S. share of military spending is set to decline as U.S. GDP growth (represented by the red bar) is lower than that of other military powers (represented by the purple bar).


If the United States decided to spend a smaller share of GDP on the military, the black line on the previous page would decline more sharply still. How likely is this? The following two charts show how U.S. overseas operations have been shrinking and that they are likely to continue to do so.


Overall funding for overseas contingency operations has declined by just over 50 percent since 2008 as the war in Iraq has wound down.

Funding for the two operations was as high as $187 billion in fiscal year 2008, which represents 30 percent of SIPRI's measure of U.S. military spending for that year.

War funding is projected to come to $79 billion in fiscal year 2014, but it is likely to decline thereafter with the winding down of the war in Afghanistan.


As of fiscal year 2013, the number of troops deployed in Afghanistan and Iraq has declined 66 percent since fiscal year 2008.

The Department of Defense projects troop levels will decline a further 40 percent in fiscal year 2014.

The following charts provide some historical perspective on military spending.

U.S. national defense spending has ranged widely, from less than 1 percent of GDP in 1929 up to 43 percent in 1944. These extremes illustrate that resource allocation to defense can increase rapidly when a war demands it.

Focusing just on the post-World War II period, U.S. national defense spending as a percent of GDP has ranged from a high of 15 percent in 1952 (during the Korean War) to a low of 3.7 percent in 2000 (the period of relative tranquility preceding the terrorist attacks of the following year).


In the post-Cold War world, the U.S. national defense budget has fluctuated within a relatively narrow band. It fell by about three percentage points of GDP as the nation reaped the peace dividend of the 1990s, then rose after the terrorist attacks of 2001.

President Barack Obama's budget proposes cutting security spending to 2.4% of GDP in 2023. This would represent the lowest allocation of GDP to defense spending in the post-World War II era.

To put U.S. military spending in context, consider GDP and population shares relative to the rest of the world, as of 2012. The pie charts demonstrate that the United States accounts for a larger share of global military spending than of either GDP or population, and would continue to even if military spending were to revert to 2000 levels as a percent of GDP.


As noted at the outset, military power depends on multiple factors, including the military budgets of a country's allies. To get a sense of this factor, the chart from page four was redone, with spending by NATO, Japan, South Korea, Israel, and Saudi Arabia added to the analysis. The United States and these allies account for a formidable 75 percent of global military spending in 2010. However, as the black line in the chart shows, the trend is less reassuring. The United States' and its allies' share of world military spending fell from 2005 to 2010. It is projected to fall further, to 60 percent by 2015, even if U.S. spending as a share of GDP holds up at today's levels. Budgetary pressures in Europe may mean this share falls even more rapidly.


Democracies are generally regarded as friendly to the United States, and this chart delivers a similar verdict to the last one. :ranger:

After the collapse of the Soviet Union, democracies accounted for the vast majority of the world's military spending.

However, since the early 1990s, this share has declined slightly.


In 2012, U.S. military spending fell faster than overall military spending by democracies.

However, the United States continues to account for almost half of all military spending by democracies.

A decline in U.S. military spending is therefore likely to have a large impact on democracies' military spending as a share of the global total. :tup:

Trends in U.S. Military Spending - Council on Foreign Relations
 
Last edited:

sunny_10

Tihar Jail
Banned
Joined
Dec 23, 2013
Messages
197
Likes
23
The U.S. Has The Worst Income Inequality In Developed World
08/15/2013

Hey, who says America is in decline? The U.S. is still more awesome than the rest of the world at making at least one thing. And that thing is income inequality.

A new paper by economists Facundo Alvaredo, Anthony B. Atkinson, Thomas Piketty, and Emmanuel Saez lays out just how much better at making inequality the U.S. is than everybody else and tries to explain how it got that way.

Since the 1970s, the top 1 percent of earners in the U.S. has roughly doubled its share of the total American income pie to nearly 20 percent from about 10 percent, according to the paper. This gain is easily the biggest among other developed countries, the researchers note. You can see this in the chart below, taken from the paper, which maps the income gains of the top 1 percent in several countries against the massive tax breaks most of them have gotten in the past several decades. (Story continues after chart.)


The higher the dot, the more income inequality has grown in that country. See the red dot waaaay up in the left-hand corner, far away from everybody else? That is the United States, where the top earners have made more while getting their taxes slashed by over 40 percent.

This echoes an OECD study from earlier this year that found the U.S. had the highest income inequality in the developed world. It followed only Chile, Mexico and Turkey among all nations.

So how did America get so darn great at ratcheting open the chasm between the haves and have-nots? Thank the dynamic duo of Wall Street and Washington, which have been working so well together for the past few decades to make laws that favor banks. Turns out this Axis Of Making It Rain has also been making laws that favor the exorbitantly wealthy. Win-win. Unless you are poor, in which case: Sorry, be born to richer parents next time, maybe?

One thing you'll notice in this chart is that, typically, the bigger the tax cuts given to the 1 percent (the horizontal scale on the chart), the bigger the income inequality. :ranger: This is consistent with other studies that have shown the tax code has a big effect on income distribution. That's one way Washington has boosted inequality: By slashing taxes on the rich, for freedom and growth and trickling down on the poor. Unfortunately, the paper points out, contrary to what you will hear from conservatives, lower tax rates on the wealthy offer no obvious benefits to growth, or to the poor.

One other thing you'll notice from the chart is that the United Kingdom has slashed taxes on the top 1 percent almost as aggressively the U.S. has, and yet the share of income going to the top 1 percent is not nearly as big. So there's something else going on here besides just tax breaks.

That something is Wall Street, more or less, as Matthew O'Brien of The Atlantic points out. The same politicians that have busily been slashing taxes on the wealthy have also been loosening fetters on banking, allowing the financial sector to swell to bloated size and mop up ever-more income while contributing ever-less back to the economy. Again, this is consistent with other studies that have attributed much of the rise in in inequality to the pay being sucked up by bankers and overpaid CEOs.

At the same time, U.S. lawmakers have also made it easier and more tax-friendly for the wealthy to pile up more capital gains on their investments. As O'Brien puts it, "The top 1 percent leveraged itself to the market, and haven't looked back." :coffee:

One nifty benefit to having nine metric craptons of money is that you can use it to buy politicians to help you craft the laws you like, particularly those that will help you end up with 10 metric craptons of money. The poor and middle class, meanwhile, just get ever more discouraged about the political system and stop bothering to fight it, increasingly turning the whole process over to the wealthy and the politicians they own, according to a recent paper by Frederick Solt at Southern Illinois University. Sound familiar?

The U.S. Has The Worst Income Inequality In The Developed World, Thanks To Wall Street: Study
 

W.G.Ewald

Defence Professionals/ DFI member of 2
Professional
Joined
Sep 28, 2011
Messages
14,139
Likes
8,594
Obama will tell you we must raise the debt ceiling "so American can pay its bills."

Just another one of his lies.
 

sunny_10

Tihar Jail
Banned
Joined
Dec 23, 2013
Messages
197
Likes
23
Obama will tell you we must raise the debt ceiling "so American can pay its bills." :toilet:

Just another one of his lies.
Ewald, its really shameful to see US's citizens commonly discussing about "borrowing debt" to pay bill. richness based on borrowing debts?? :ranger:


I has as many as 200 employees at times working for me, I don't think I ever knew what religion they were, or cared. Religion is not really a subject for discussion in the USA.

Mr Obama is Misusing Tax Money of his Tax Payers

US needs more Humanitarian aids for its own people, as compare to giving to those who aren't US's citizens

AA, its proud to know that we have an Industrialist with us too. but as per your flag on this forum, there are 3 main possibilities of "Average Americans", as below :ranger:

1st; Chance is less than 1% that you belong to an Industrialist group of USA, as per the facts of USA as below

2nd; chance is around 37% that you don't have any source of income, as only around 63% working age people of US has any job, which exclude house wives, students, early retired people etc too.
Bureau of Labor Statistics Data

3rd; and, there is around 47/315 = 15% chance that you are dependent on Food Stamp to feed yourself.


(here as below, $30,000 or less income does means for less than 18 lacs Rupees a year but prices in USA is also different. even a medium size coffee cost $3.2 (Rs 200) on the streets of Sydney and food no less than $10 (Rs 600) on any shop. hence $30,000 or less income for 53% working age group does mean for a "non-luxury" life. which exclude those 37% of working age group who don't even have any source of income.)

and its worth mentioning that these 37% people of US avoid slum because of $1.2trillion+ borrowing for their social security/free medical etc.. the USA which is already indebted by a huge $17.4trillion+ debt to date....... )


40 'Frightening' Facts On The Fall Of The US Economy
05/27/2013

#1, Back in 1980, the U.S. national debt was less than one trillion dollars. Today, it is rapidly approaching 17 trillion dollars...

#17, Back in 1950, more than 80 percent of all men in the United States had jobs. Today, less than 65 percent of all men in the United States have jobs. :facepalm:

#18, At this point, an astounding 53 percent of all American workers make less than $30,000 a year. :toilet:

#21, In the United States today, the wealthiest one percent of all Americans have a greater net worth than the bottom 90 percent combined. :usa::tsk:

#39, When Barack Obama first entered the White House, about 32 million Americans were on food stamps. Now, more than 47 million Americans are on food stamps.

40 'Frightening' Facts On The Fall Of The US Economy | Zero Hedge
 
Last edited:

pmaitra

Senior Member
Joined
Mar 10, 2009
Messages
33,262
Likes
19,594
It all started long time back and the first biggest mistake was this:


This is when the US walked away from the fiscal discipline that the Constitution called for.
 

sunny_10

Tihar Jail
Banned
Joined
Dec 23, 2013
Messages
197
Likes
23
It all started long time back and the first biggest mistake was this:
This is when the US walked away from the fiscal discipline that the Constitution called for.

there are few mistakes which they did as a society and paying its price...... its a society which is based on superiority-inferiority, with having lost competency to an extent while being in this bluff. and when other societies are rising, while they are habituated of living in the bluffs of superiority of 80s-90s. and having look on the highest crime rate of US in world, if they withdraw social security/free medical etc, they will simply start fighting with each others on the streets........
as discussed as below :ranger:

http://defenceforumindia.com/forum/religion-culture/58720-study-high-crime-rate-us-west.html


and this fall is set to continue until they learn by 'time'. and they are not borrowing debt but a TIME to avoid an inevitable fall, with a hope of a miracle which may change their set fall :wave:

they know, they will have pay back anything they are borrowing right now, and they are mainly trying to get something done in other countries, as simply they are helpless to an extent to build their society from bottom :ranger:
 
Last edited:

Latest Replies

Global Defence

New threads

Articles

Top